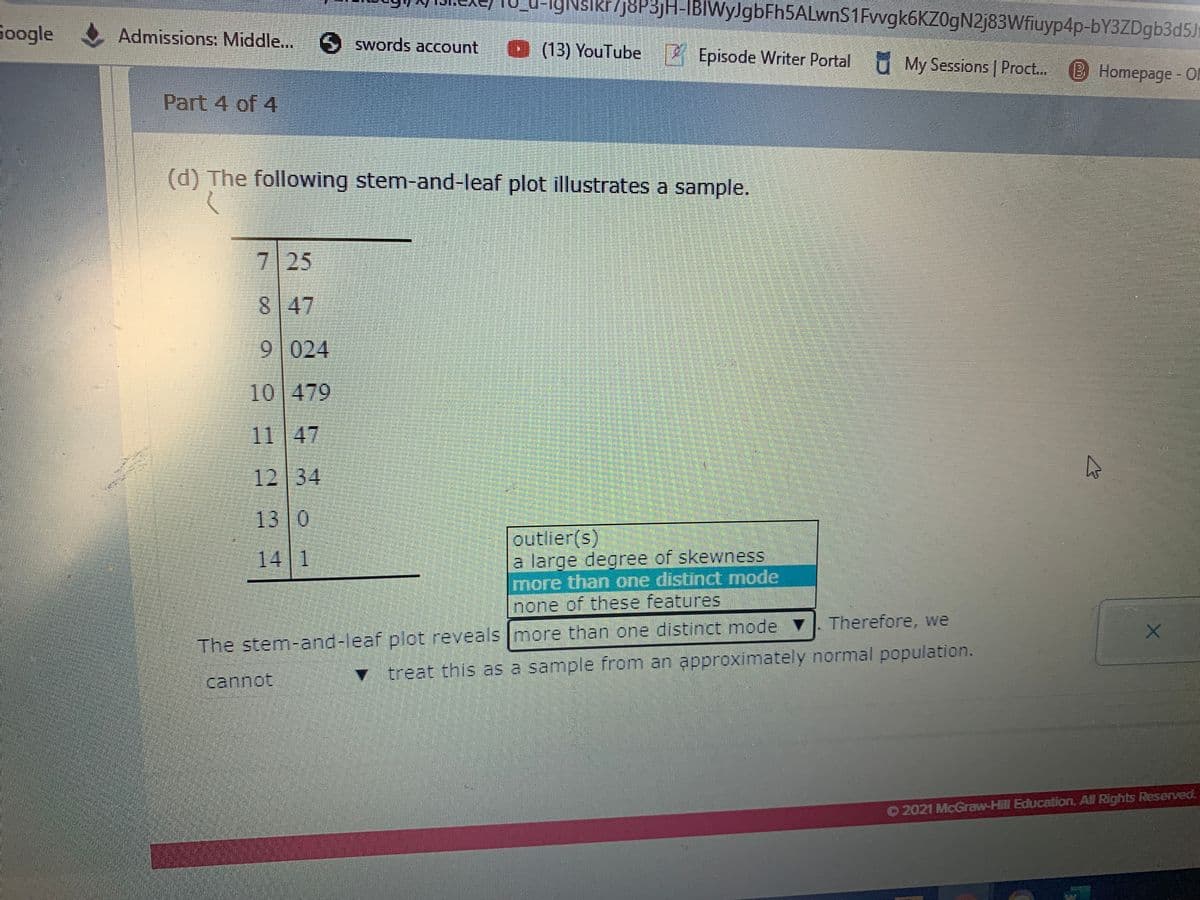
(d) The following stem-and-leaf plot illustrates a sample. 7 25 8 47 9 024 10 479 11 47 12 34 13 0 outlier(s) a large degree of skewness more than one distinct mode none of these features 14 1 Therefore, we The stem-and-leaf plot reveals Imore than one distinct mode ▼ v treat this as a sample from an approximately normal population. cannot
Q: 12. The red blood cell count for a population of adult males can be approximated by a normal…
A: We have given that X~N( μ , ?^2 ) μ = 5.4 , ? = 0.4 Z-score =( x - μ )/? ,
Q: The following set of data is from a sample ofn=7. 8 7 4 9 1 7 13 D a. Compute the mean, median, and…
A: Since you have posted a question with multiple sub-parts, we will solve first three sub- parts for…
Q: The contents of cans of Coca-Cola vary slightly in weight. Here are the measured weights of seven…
A:
Q: Which of the following is TRUE about the variance of the sampling distribution of sample means? It…
A:
Q: Find the midrange and sample variance of the scores of Psychology students in their GMath quiz are…
A: Given: The stem and leaf diagram of the scores of Psychology students in their GMath quiz is: 1…
Q: 3. What could be the approximate value of the corelation coefficient for the accompanying scatter…
A: 3. It is clear that the data points are closer to each other and also observed that as the values of…
Q: Compute the standard scores for the batting averages of Cobb, Williams, and Brett to compare how far…
A: Given: Decade Mean sd Sample mean 1910 0.266 0.0371 0.42 1940 0.267 0.0326 0.406 1970…
Q: 2 The time, in minutes, to complete 200 games of chess is shown in the table. Time, x minutes…
A: Given :
Q: The mean is _______ The standard deviation is _________ B. Compute the test…
A:
Q: 44. The following stem-and-leaf plot was found to display information regarding the number of girls…
A:
Q: Consider that X1, X2, X3, X4, X5 is an independent random sample where Xi follows a normal…
A:
Q: 3. The costs per load (in cents) of 35 laundry detergents tested by a consumer organization are…
A: Formula : mean : sample variance :
Q: i) Following are the scores for students of physics (X): X 15 13 18 14.5 12 11 8.9 8 a) Determine…
A: Given, the data on the scores for students of Physics (X) a). The required value of sample mean is…
Q: Here is a bivariate data set in which you believe y to be the response variable. y 22.5 28.8 41.8…
A: Given: X Y 22.5 28.8 41.8 66.4 38.5 25.4 40.6 18.3 43.6 27.3 43.5 43.8 23.9 -2.1…
Q: 1. A magazine claims that the mean amount spent by a customer at Burger Stop is greater than the…
A:
Q: Construct a box plot of data. What does the shape of the box plot imply about the concentration of…
A: Note: Hi there! Thank you for posting the question. As your question has more than 3 parts, we have…
Q: Consider that X1, X2 X3, X4, X5 is an independent random sample where X, follows a normal…
A: Solution: Given information: Xi~N(μx=3.2, σx2=3.2) i= 1,2,..,5n1=5 Sample size of XYi~N(μy=…
Q: Q2: At SQU hospital there is some concern about the high turnover of nurses. A survey was done to…
A: Given : At SQU hospital there is some concern about high turnover of nurses . A survey was done to…
Q: The test scores of 20 students on a 100-point test were recorded. 72 92 93 84 73 74 85 81 77 55 83…
A:
Q: A researcher wants to know if male and female college students differ with regard to their GPAs. She…
A:
Q: (1) State one disadvantage of displaying data in groups (ii) Use the table above to estimate the…
A: Given: data TO find : i) disadvantage of grouping data ii) a)mean b)median c)sample…
Q: 9. Which of the following plots indicate a sample correlation coefficient close to 0? A. First plot…
A: If there is no correlation then the value of the correlation coefficient is 0.
Q: 8) Following are box-and-whisker plots comparing the study times in hours per week for Sarah and…
A: A box and whisker plot is given : Firstly find the five number summary from box and whisker plot. We…
Q: 11 The mean of prices of computers is OMR 176 and the coefficient of variation (CV.) is (7.5%). Find…
A:
Q: 12. The Department of Health has the following data of the number of infected persons of Covid-19 in…
A: Solution : We have given that the number of infected persons of Covid-19 in five high-risk areas in…
Q: Compute the mean and the median of the raw data in (1) above. Based solely on the relationship…
A: Provided data is; 5, 5, 5, 6, 7 a. Mean of the data can be calculated as: x=∑i=1nxin=5+5+5+6+75=5.6…
Q: B. A sample data has a distribution that has a single mode and is strongly positively skewed. An…
A: A distribution is said to be positively skewed if it has a tail elongated toward right. For…
Q: Assignment - 1. Pre-Test Attempt 1 of 1 GNMENTS COURSES SECTION 1 OF 1 QUE 2 3 4 5 6 7 8 9 10 11 12…
A: In Normal Distribution, The mean is the average of a data set. The mode is the most common number in…
Q: 0.) The following table contains cholesterol levels of 32 people. Determine if the sample comes from…
A: Outliers: Outliers can be described as extremely low or high values that do not fall near any other…
Q: (a) true (b) false 3. Variance is one type of measure (a) central tendency (b) standard numbers (c)…
A: 1. The sampling method is one of the methods of data collection. a. True. We are collecting the data…
Q: Listed below are amounts (in millions of dollars) collected from parking meters by a security…
A: See the hand written solution See the table
Q: Example 16. The Mean, Mode and Q.D. of a distribution are 42, 36 and 15 respectively. If its…
A: Given that, the mean, mode and Q.D. of a distribution are 42,36 and 15 respectively. Its Bowley's…
Q: 8.3. 3.The table below shows the number of hours per day 11 patients suffered from headaches before…
A: Hello! As you have posted more than 3 sub parts, we are answering the first 3 sub-parts. In case…
Q: Q2: At SQU hospital there is some concern about the high turnover of nurses. A survey was done to…
A: Given that, 2, 5, 7, 8, 8, 11, 12, 14, 20, 23, 23, 25, 26, 27, 28, 29, 31, 36, 36, 42 N=20
Q: (i) State one disadvantage of displaying data in groups (ii) Use the table above to estimate the…
A: CI f cf x fx fx^2 9.5-24.5 2 2 17 34 578 24.5-39.5 6 8 32 192 6144 39.5-54.5 8 16 47 376 17672…
Q: (b) Fill in the missing data. (Round your table of means values to 1 decimal place, SS and Fvalues…
A: b) Fill the missing data. (Round your table of Means values to 1 decimal places, SS and F values to…
Q: 4 6. 7 9. A journal editor rejected the linear correlation analysis of the researcher upon seeing…
A: Scatterplot shows the relationship between two variables. It is used to represent the correlation…
Q: 1. The maximum number of sit-ups completed by the participants in an exercise class after 1 month of…
A: Note: Hey there! Thank you for the question. As you have posted multiple questions, as per our…
Q: Which of the following statements about measures of variability is true? Select one: a. Mean is…
A: Shape of the distribution:For symmetric data, the mean, the median and the mode are equal.For a…
Q: Need to show all work such as calculator steps.
A: 3. Define the variable x that represents the number of defective items produced on an assembly line…
Q: (a) An indicator of the value of a stock relative to its earnings is its price-carnings ratio. The…
A: First, calculate the grand mean from the given table as follows,…
Q: #8 Health: Cigarette Smoke Make a stem-and-leaf display using the following data. This data…
A: Given data:…
Q: Which statement is true about the dot plot? 2 3 4 5 O The data is fairly uniform. O The mean is…
A: We have to find the answer
Q: Astudy is undertaken to investigate the self-reported health status among women with osteoporosis.…
A: The median is middle value of the observations, above or below which 50% of the observations lie.
Q: Example 9.25 The following table gives the distribution of height status among the management train-…
A:
Q: 3-7. Consider the following data that represent the commute distances for students who attend Emory…
A: Given: The provided data is: 3.1 4.7 8.4 11.6 12.1 13 13.4 16.1 17.3 20.8 22.8 24.3 26.2 26.6…
Q: The test scores of 20 students on a 100-point test were recorded. 72 91 92 | 85 73 75 84 84 77 58 83…
A:
Q: Define the meaning of outliers. (a) (b) Explain THREE (3) tests for outlier detection in regression…
A: Given information: Q4(c) 3021.439.433.421.129.332.831.63627.927.329.429.138.633.829.137.1
Q: Question 2 (CLO 2) Marks The following is the sample distribution for the age of computers used by…
A:
Tell me what the stem-leaf plot reveal
Trending now
This is a popular solution!
Step by step
Solved in 2 steps with 1 images
- Let's assume that there are 500 people in a population. The researcher has access to all 500 participants, and sends a questionnaire that is accessed by a hyperlink. Of the 500 possible subjects, 485 complete it. Does this mean that the results generated from this study will be highly-accurate? What might cause the study to be unreliable?to run 2k factorial design in 8 blocks it is necessary to select 3 factors or interactions to form the blocks. as a result there will be a yotal number of effects confounded with blocks equal toThe city of San Fransokyo is a high-tech city, especially in the field of robotics. There are three big companies that rule the city: Granville, Axcel, and Hamada. The Granville company controls about 50% of the total robot manufacturing in the city of San Fransokyo; Axcel company controls 35%; while the rest is controlled by the Hamada company. Based on the information you have obtained, it turns out that 3% of the robots made by Granville have problems with the sensing ability of the robot. As much as 5% robots made by Axcel and 1% robots made by Hamada also have the same problem. You want to buy a robot to help with your business and randomly pick up exactly one robot from the three companies. After the item arrives, you do a test, and it turns out that the robot is experiencing a malfunction in its sensing component. Using the Bayes Rule approach, which company is predicted to make the robot you bought? Justify your answer with adequate calculations!
- A snowboard manufacturer has three plants, one in the eastern United States, one in the western United States, and one in Canada. Production records show that the U.S. plants each produced 10,000 snowboards last month, while the Canadian plant produced 8000 boards. Of all the boards manufactured in Canada last month, 4% had a defect that caused the boards to delaminate prematurely. Records kept at the U.S. plants show that 3% of the boards manufactured in the eastern United States and 6% of the boards manufactured in the western United States had this defect as well. a) What proportion of the boards manufactured last month were defective? b) What is the probability that a snowboard is defective and was manufactured in Canada? c) Given that a snowboard is defective, what is the probability that it was manufactured in the United States?A marketing research group conducting a telephone survey must contact at least 150 wives and 120 husbands. It costs P100 to make a daytime call and (because of higher labor costs) P150 to make an evening call. On average, daytime calls reach wives 30% of the time, husbands 10% of the time, and neither of these 60% of the time, whereas evening calls reach wives 30% of the time, husbands 30% of the time, and neither of these 40% of the time. Staffing considerations mean that daytime calls must be less than or equal to half of the total calls made. How many should be interviewed at each period to minimize the cost of completing the survey? fomulate the LP Model; identify the decision variables used in the model; and determine the optimal solution using graphical method.There are X-Mart and Y-Mart convenience stores. It is assumed that each customer purchases once a week at one of the two supermarkets (but not both). In a study, a sample of 100 buyers was taken for 10 weeks. From this research it is known that if buyers go to X-mart store one week, 85 people will still buy at X-mart store the following week and if buyers go to Y-mart store one week, 70 people will still buy at Y-mart store. mart the following week. 1. Make a table and matrix of transition probabilities. 2. If John purchases at X-mart in the first week, what is the probability that Bob purchases at X-store in the third and fourth weeks?
- In soccer team “M,” there are two playmakers: Player A, and Player B, and two goal scorers: Player X and Player Y. Based on extensive data collection of 100 goals that were scored in the last two seasons by this team: player A created 60 of the goals, while player B created the remaining 40. Among the plays that were created by player A, 38 goals were scored by player X, and the remaining 22 goals were scored by Player Y. Among the plays that were created by Player B, 15 goals were scored by Player X, while the remaining 25 goals were scored by player Y. In a new match, you heard that Player X scored a goal, what is the probability that this goal was created by Player A?An instructor teaches three introductory Medicine sections covering the same material. He has made up a different final exam for each section. Still, he suspects that one of the versions is more difficult than the other two. he decides to experiment to evaluate the difficulty of the exams. He randomly selects five volunteers for each class during the review period just before finals. Class 1 volunteers are given version 1 of the exams, Class 2 volunteers get version 2, and Class 3 volunteers receive version 3. Of course, all volunteers are sworn not to reveal any of the exam questions, and also, all of the volunteers will receive a different final exam from the one they took in the experiment. The following are the results. Does this study suffice the assumptions in employing One-way ANOVA in interpreting the results? Explain why or why not?The television show Lett3rs has been successful for many years. That show recently had a share of 19, which means, that among the TV sets in use, 19% were tuned to Lett3rs. An advertiser wants to verify that 19% share value by conducting its own survey, and a pilot survey begins with 10 households have TV sets in use at the time of a Lett3rs broadcast. If at most one household is tuned to Lett3rs, does it appear that the 19% share value is wrong? (Hint: Is the occurrence of at most one household tuned to Lett3rs unusual?) A. no, it is not wrongB. yes, it is wrong
- A political strategist claims that 58% of voters in Madison County support his candidate. In a poll of 500 randomly selected voters, 260 of them support the strategist's candidate. At alpha = .05, is the political strategist's claim warranted?In a top business school, 60% of its students are female, and 40% are male. All of them have totake a core module, Business Analytics. Although there are quite a number of students who like themodule, there are also quite a number who dislike it. The remaining students are indifferent to it.A study found that 40% of the female students dislike the module. Only 25% of male students dislikeit. Moreover, only 10% of students are indifferent to it. Interestingly, equal numbers of male andfemale students are indifferent to it, among all students. Given that a student who like Businessanalytics, what is the probability that this student is a male student?A system consists of two components. The probability that the second component functions in a satisfactorymanner during its design life is 0.9, the probability that at least one of the two components does so is 0.96,and the probability that both components do so is 0.75. Given that the first component functions ina satisfactory manner throughout its design life, what is the probability that the second one does also?