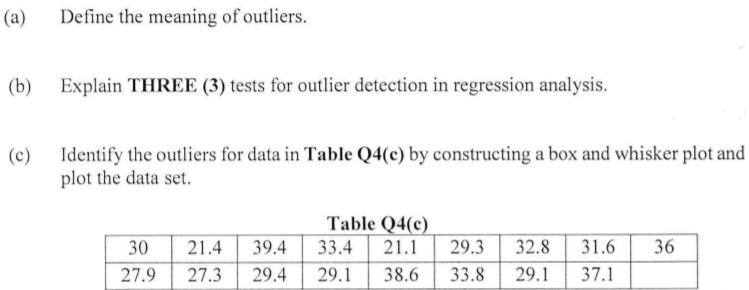
Define the meaning of outliers. (a) (b) Explain THREE (3) tests for outlier detection in regression analysis. Identify the outliers for data in Table Q4(c) by constructing a box and whisker plot and plot the data set. (c) Table Q4(c) 30 21.4 39.4 33.4 21.1 29.3 32.8 31.6 36 27.9 27.3 29.4 29.1 38.6 33.8 29.1 37.1


Q: the five-number summary, and (b) draw a box-and-whisker plot of the data. 3 8 8 4 1 9…
A: In descriptive statistic for non-grouped data, there is five important number that helps us to…
Q: Which of the following phrases describes what we see in the following error plot? (Residual is…
A: Residual plot: Residual plot is a graph used to identify the lineariaty, heterosedacity and fit of…
Q: A random sample of boarding school students was asked how many 8-ounce servings of soda they had…
A: a) In regression theory, dependent variable is the response variable, which is predicted using the…
Q: Q4 As a factory manager, you are concem about the health of your workers. In this regard, you have…
A: Q4. Let x be the working temperature and y be the water consumption. The scatter plot is obtained…
Q: Rox Fried Chicken is a widely known restaurant. Rox Fried Chicken has good taste and affordable…
A: (a) Data : $25.50, $24.50, $25.30, $26, and $24.70 . Average price is admitted to be $25 .
Q: Here is a histogram and Q-Q plot of the water Turbidity in local rivers. Turbidity is a measure of…
A: Given: Histogram and Q-Q plot of the water Turbidity
Q: 아 3 4 5 6. c1 Center: Mean: Median: Variation: St. Dev.: Range: 5-Number Summary: Min.: Q1: Q2: Q3:…
A: The given Dot-plot shows data values with their frequencies S.No. Data value frequency 1 2 3…
Q: The box-and-whisker plots show the monthly car sales for a year for two sales representatives.…
A: The solution is given as follows
Q: 2 The time, in minutes, to complete 200 games of chess is shown in the table. Time, x minutes…
A: Given :
Q: 1. Find the slope of the median-median line for the dataset. y 3. 4 4 1.
A:
Q: Mrs. Campbell created the box-and-whisker plots below using the results of the fifth and sixth grade…
A:
Q: A merchant's sale (*00s tons) of ordinary coal over a period were as shown below: Quarters Years I…
A: Given, Quarters Years 1 2 3 4 2011 118 87 47 83 2012 94 73 41 68 2013 73 61 36 56
Q: The box plots show the number of members at two local gyms. Gym A Gym B 20 22 24 26 28 30 32 34 36…
A: Given two boxplots that show the number of members at two local gyms.
Q: Grintield Service company's marketing director is interested in analyzing the relationship between…
A:
Q: A box-and-whisker plot only shows certain things about a data set. Which of the following cannot be…
A: A Box-Whisker plot is a type of graph which helps to visualize data set, so as to estimate the…
Q: The graph shown is a summary of the number of items sold by two classes for a school fundraiser.…
A: Variation denotes how much the data in a dataset is dispersed away from the central value. The…
Q: Is the data point P in the picture... ...an influential point ...a leverage point ...none of the…
A: an outlier is a data point that differs significantly from other observations. An outlier may be due…
Q: 3- Listed below are the selling prices (in thousands of dollars) of a sample of 20 vehicles sold by…
A: Dot Plot: The dot plot also known as the strip plot or dot chart, by using this dot plot we can…
Q: Room and board costs for selected schools are summarized in this distribution. A Costs (in dollars)…
A: Room and board costs for selected schools are summarized in this distribution. Cost Frequency…
Q: A researcher desires to know if the age of a child is related to the number of cavities he or she…
A: (1): H0:ρ=0 (there is no linear relationship between age of a child and no. of the cavities). H1:…
Q: A safety engineer is testing for the severity of head injuries on crash test dummies. 98 crashes…
A: Given: Minitab output
Q: Sugar content (in grams per serving) for 18 high-fiber cereals are shown below. Sugar Content 12 6…
A: a) Arranging the data set into ascending order as follows:…
Q: You are examining a data set with a condensedstem-and-leaf plot. (Hint: Look at the plot…
A: Given, The condensed stem and leaf plot. In condensed stem-leaf plot * represent the join of two…
Q: PART IV: Now, we will return to the complete data set and divide into two new groups: male and…
A: Since you have asked multiple questions, we will solve the first question for you. If you want any…
Q: A doctor wanted to determine whether there is a relation between a male's age and his HDL (so-called…
A: Obtain the 95% confidence interval for slope. The 95% confidence interval for slope is obtained…
Q: Hello, Consider, a researcher wants to identify the relationship between the height and weight of…
A: We want to find the regression line and scatter plot.
Q: 2. A school keeps a record of drinks purchased from their cafeteria. The data in the table show the…
A: Due to Bartleby guidelines, only 1question can be solved. Please repost the remaining questions to…
Q: homes of off-campus statistics students to the college. Create a stem plot using the data and…
A:
Q: What is an advantage of using a stem-and-leaf plot instead of a histogram? O A. Stem-and-leaf plots…
A: First of all, we know that the A stem and leaf plot is a representation of data into a tabular form…
Q: en corvettes between 1 and 6 years old were randomly selected from the classified ads of The Arizona…
A: Linear regression
Q: A researcher studying mouse behaviour recorded the time (in seconds) it took 15 different mice to…
A: In every statistical analysis, before moving to any inferential statistics we do descriptive…
Q: (b) Describe how the presence of possible outliers might be identified on (i) Histograms Gap…
A: Box and-whisker plot:A type of graph used to display patterns of quantitative data is called a…
Q: For the dataset below, do a complete box-and-line plot analysis. 3 15 18 19 23 23 26 27 28 29 50…
A: Since, the data is already in the ascending order, then the first quartile of the given data…
Q: 2. A school keeps a record of drinks purchased from their cafeteria. The data in the table show the…
A: Since you have asked multiple questions, so we will solve the first question for you. If you want…
Q: 10. The BOx and WhIsker plotS compare the weekly salaries, in dollars, of a sample of 25-year-old…
A: From the Boxplot we can find the Five number summary table. It includes, Minimum, First quartile,…
Q: Class A Class B 10 15 20 26. Which statement about the box plots is true? A. Class A has a larger…
A: 26. On observing the box plots, the following statements are found to be true- A. True, since the…
Q: Tiffany is a manager who needs to fire the worst performing 3% of employees. At her organization,…
A: Given that, Employee performance is a normally distributed variable. Tiffany is a manager who needs…
Q: 75 22.7 87.9 -17.6 54.3 22.8 58.5 42.6 53.6 71.4 -188.9 67.9 55.7 63.2 26.4 72.5 83.4 -14.4 47.2…
A: The scatter plot is The point (-188.9, 67.9) is an outlier as it lies far away from the other…
Q: 1595 1472 1820 1580 1804 1635 1959 2020 1480 1250 2083 2622 1306 1572 1778 2296 1455 1716 1618 1824…
A: The five number summary of the data includes first, second and, third quartiles, minimum and maximum…
Q: ome of the Hope Squad at Syracuse JHS work as volunteers at a homeless shelter. The table shows the…
A: Five number summary include minimum value, first quartile, median, third quartile, maximum value and…
Q: Which of the equations best represents the trend line for the data in the scatter plot? C = 150L +…
A:
Q: Astudy is undertaken to investigate the self-reported health status among women with osteoporosis.…
A: The median is middle value of the observations, above or below which 50% of the observations lie.
Q: Technical “item bias” refers to statisticians’ interest in the performance of a measure on which of…
A: Given: Technical “item bias” refers to statisticians’ interest in the performance
Q: For the dataset below, do a complete box-and-line plot analysis. 3 15 18 19 23 23 26 27 28 29 50…
A: Hello! As you have posted more than 3 sub parts, we are answering the first 3 sub-parts. In case…
Q: 2. A school keeps a record of drinks purchased from their cafeteria. The data in the table show the…
A:
Q: Which of the following statements about descriptive analysis is FALSE? * for most projects,…
A: Given four statements about descriptive analysis. 1. for most projects, statistical analysis begins…
Q: An auctioneer of antique Iranian rugs kept records of his weekly auctions in order to determine the…
A: Hi, there! As per the guidelines we are allowed to answer three subparts at a time. Kindly repost…
Q: Working with Large Data Sets High School Completion. As reported by the U.S. Census Bureau in…
A: a)Step-by-step software procedure to draw stem and leaf plot using MINITAB software is as…

Step by step
Solved in 4 steps with 1 images

- With regard to regression, which of the following statements about outliers are true? I. Outliers have large residuals. II. A point may not be an INFLUENTIALoutlier even though its x-value is an outlier in the x-variable and its y-value is an outlier in the y-variable. III. Removal of an outlier sharply affects the regression line. II and III I, II, and III I and II I and III I only ( don't hand writing solution)A university would like to examine the linear relationship between a faculty member's performance rating (measured on a scale of 1-20) and his or her annual salary increase. The table to the right shows these data for eight randomly selected faculty members. Complete parts a and b.1. Amanda Boleyn, an entrepreneur who recently sold her start-up for a multi-million-dollar sum, is looking for alternate investments for her newfound fortune. She is considering an investment in wine, similar to how some people invest in rare coins and fine art. To educate herself on the properties of fine wine, she has collected data on 13 different characteristics of 178 wines. Amanda has applied k-means clustering to this data for k = 1, ... , 10 and generated the following plot of total sums of squared deviations. After analyzing this plot, Amanda generates summaries for k = 2, 3, and 4. Which value of k is the most appropriate to categorize these wines? Justify your choice with calculations. Answer the following: Do not round intermediate calculations. If required, round your answers to two decimal places. k = Cluster 1 to Cluster 2 Distance / Cluster 1 Average Distance = Cluster 2 to Cluster 1 Distance / Cluster 2 Average Distance = Average = k = 3Cluster 1…
- An auctioneer of antique Iranian rugs kept records of his weekly auctions in order to determine the relationships among price, age of carpet or rug, number of people attending the auction, and the number of times the winning bidder had previously attended his auctions. He felt that, with this information, he could plan his auctions better, serve his steady customers better, and make a higher overall profit for himself. The results shown in the accompanying table were obtained.In a study of the stability of IQ scores, a large group of individuals is tested once at age 18 and again at age 35. The following results are obtained. At age 18: average score = 100, SD = 10At age 35: average score = 100, SD = 10 The correlation coefficient between scores at age 18 and 35 is 0.60 and the scatter plot is football shaped. What percent of the individuals with a score of 120 at age 18 score more than 100 at age 35?Ten corvettes between 1 and 6 years old were randomly selected from the classified ads of The Arizona Republic. The following data were obtained, where x denotes age, in years, and y denotes price, in hundreds of dollars. X (age) 6 6 6 2 2 5 4 5 1 4 Price (100ths) 270 260 275 405 364 295 335 308 405 305 Does a linear relationship exist between the age of a corvette and its price? (use the critical value to explain)If appropriate, explain the slope in context.If appropriate, explain the y-intercept in context.Predict the price of a one-year-old corvette.Find the Residual of a one-year-old corvette
- Mumbai Electronics is planning to extend its marketing region from the western United States to include the midwestern states. In order to predict its sales in this new region, the company has asked you to develop a linear regression of DVD system sales on price, using the following data supplied by the marketing department: Sales 418 384 343 407 432 386 444 427 Price 98 194 231 207 89 255 149 195 a. Use an unbiased estimation procedure to find an estimate of the variance of the error terms in the population regression. b. Use an unbiased estimation procedure to find an estimate of the variance of the least squares estimator of the slope of the population regression line. c. Find a 90% confidence interval for the slope of the population regression line.A researcher desires to know if the age of a child is related to the number of cavities he or she has. The data is below. Age of child, x 6 8 9 10 12 14 No. of cavities, y 2 1 3 4 6 5 Perform a hypothesis test to determine if there is a linear relationship between the variables. Find the coefficient of determination and interpret it Using s, determine if there are any outliers.A manufacturing company is interested in predicting the number of defects that will be produced each hour on the assembly line. The managers believe that there is a relationship between the defect rate and the production rate per hour. The managers believe that they can use production rate to predict the number of defects. The following data were collected for 10 randomly selected hours. Defects (Y) Production rate per hour(X) 2 40 3 45 1 35 2 37 3 40 2 40 3 45 2 30 1 30 4 30 (a). Construct a scatter plot diagram and comment on the relationship between y and x (b). Calculate the correlation coefficient (r) between x and y and comment on the result. (c). Find the coefficient of determination and interpret the result.
- A sample correlation r = 0.60 indicates a stronger linear relationship than r = 0.40. True FalseThree landmarks of baseball achievement are Ty Cobb's batting average of 0.420 in 1911, Ted Williams' 0.406 in 1941, and George Brett's 0.390 in 1980. These batting averages cannot be compared directly because the distribution of major league batting averages has changed over the years. The distributions are quite symmetric and, except for outliers such as Cobb, Williams, and Brett, reasonably Normal. While the mean batting average has been held roughly constant by rule changes and the balance between hitting and pitching, the standard deviation has dropped over time. Here are the facts: Decade Mean Std. dev. 1910s 0.266 0.0371 1940s 0.267 0.0326 1970s 0.261 0.0317 Compute the standard scores for the batting averages of Cobb, Williams, and Brett to compare how far each stood above his peers. Enter your answers to two decimal places. Ty Cobb's standard score: Ted Williams' standard score: George Brett's standard score:Given the following data on lawnmower engine emissions and age of the lawnmower Age Emission 0 1.72 0 4.38 2 4.06 11 1.26 7 5.31 16 0.57 9 3.37 0 3.44 12 0.74 4 1.24 Construct a scatterplot of emissions versus age What are the characteristics of the scatter plot? Do age and emission appear to be related?
