Data Management - Statisitcal Analysis Describe each graph seperately. Explain the type of graph with description of variables as well as any visual TREND/relation in data. (I.e. negative trend, etc.)
Data Management - Statisitcal Analysis Describe each graph seperately. Explain the type of graph with description of variables as well as any visual TREND/relation in data. (I.e. negative trend, etc.)

MATLAB: An Introduction with Applications
6th Edition
ISBN:9781119256830
Author:Amos Gilat
Publisher:Amos Gilat
Chapter1: Starting With Matlab
Section: Chapter Questions
Problem 1P

Related questions
Question
Data Management - Statisitcal Analysis
Describe each graph seperately. Explain the type of graph with description of variables as well as any visual TREND/relation in data. (I.e. negative trend, etc.)
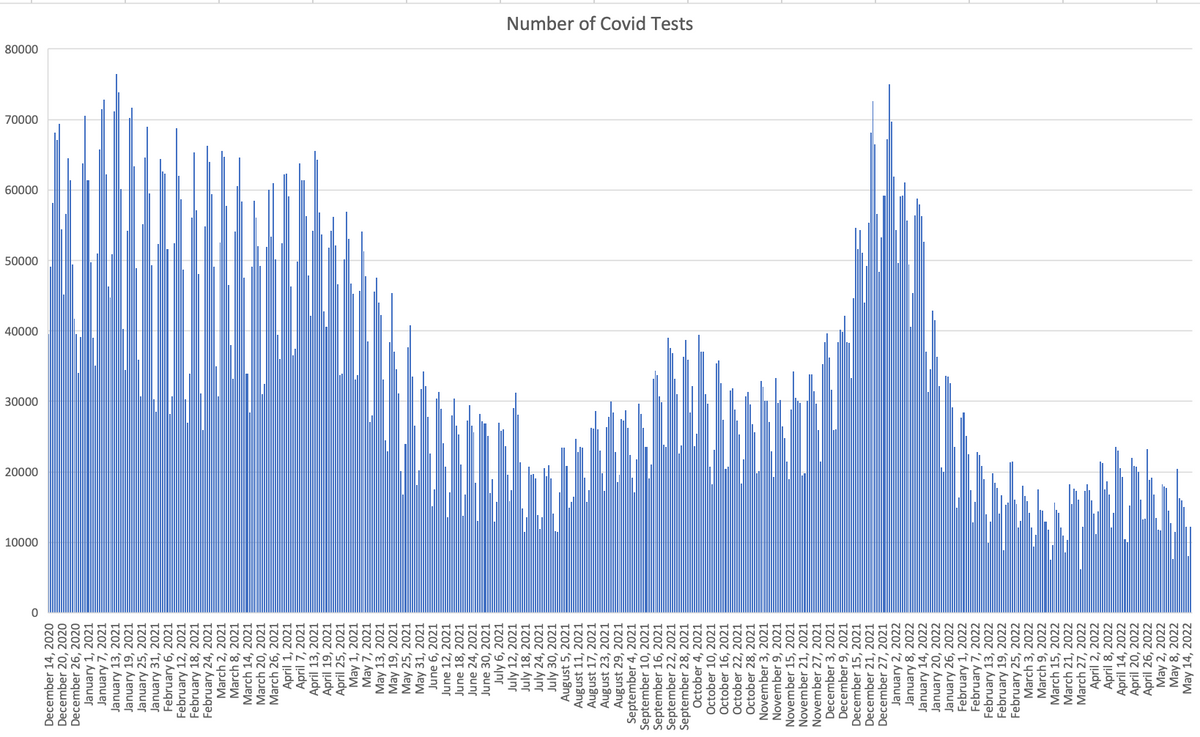
Transcribed Image Text:December 14, 2020
December 20, 2020
December 26, 2020
January 1, 2021
January 7, 2021
January 13, 2021
January 19, 2021
January 25, 2021
January 31, 2021
February 6, 2021
February 12, 2021
February 18, 2021
February 24, 2021
March 2, 2021
March 8, 2021
March 14, 2021
March 20, 2021
March 26, 2021
April 1, 2021
April 7, 2021
April 13, 2021
April 19, 2021
April 25, 2021
May 1, 2021
May 7, 2021
May 13, 2021
May 19, 2021
May 25, 2021
May 31, 2021
June 6, 2021
June 12, 2021
June 18, 2021
June 24, 2021
June 30, 2021
July 6, 2021
July 12, 2021
July 18, 2021
July 24, 2021
July 30, 2021
August 5, 2021
August 11, 2021
August 17, 2021
August 23, 2021
August 29, 2021
September 4, 2021
September 10, 2021
September 16, 2021
September 22, 2021
September 28, 2021
October 4, 2021
October 10, 2021
October 16, 2021
October 22, 2021
October 28, 2021
November 3, 2021
November 9, 2021
November 15, 2021
November 21, 2021
November 27, 2021
December 3, 2021
December 9, 2021
December 15, 2021
December 21, 2021
December 27, 2021
January 2, 2022
January 8, 2022
January 14, 2022
January 20, 2022
January 26, 2022
February 1, 2022
February 7, 2022
February 13, 2022
February 19, 2022
February 25, 2022
March 3, 2022
March 9, 2022
March 15, 2022
March 21, 2022
March 27, 2022
April 2, 2022
April 8, 2022
April 14, 2022
April 20, 2022
April 26, 2022
May 2, 2022
May 8, 2022
May 14, 2022
10000
20000
50000
0
60000
70000
80000
Number of Covid Tests
Transcribed Image Text:1000
900
800
700
600
500
400
300
200
100
0
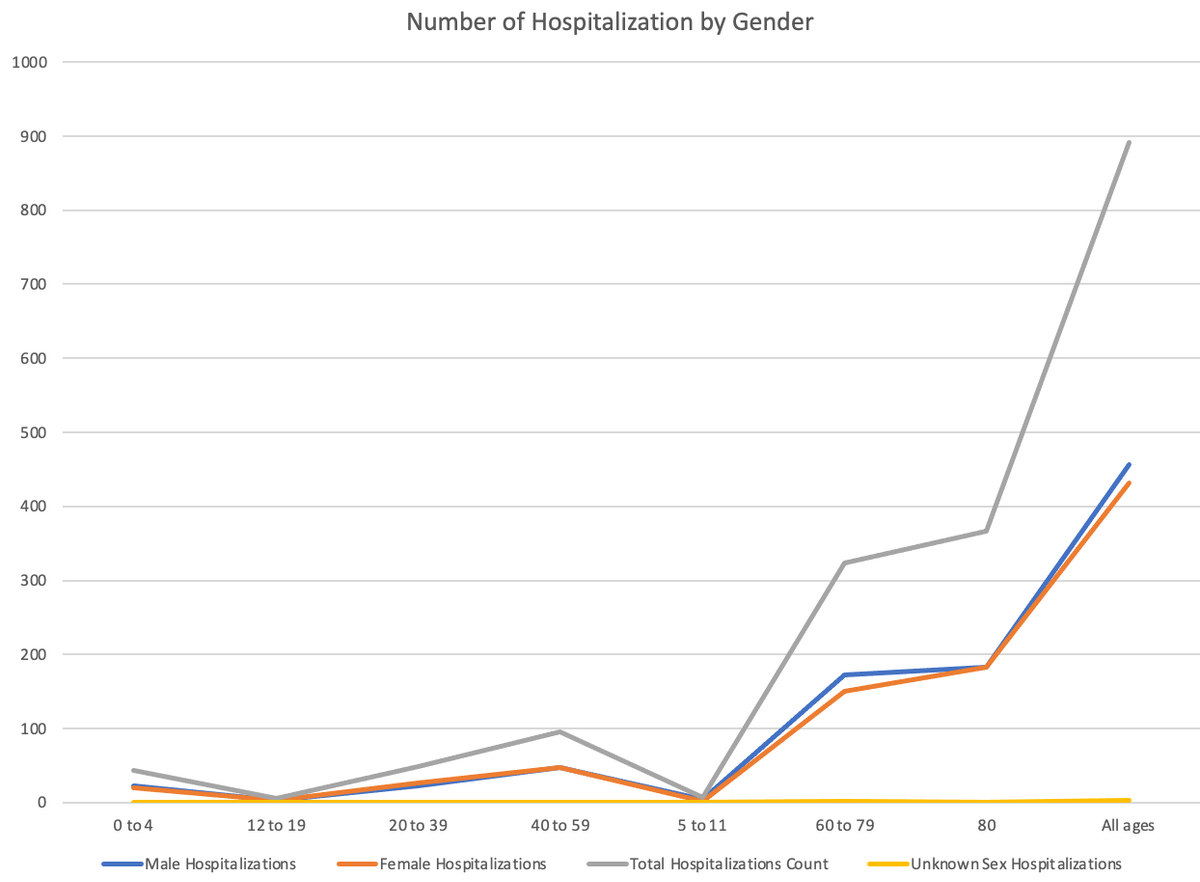
0 to 4
12 to 19
Male Hospitalizations
Number of Hospitalization by Gender
20 to 39
40 to 59
5 to 11
Female Hospitalizations
Total Hospitalizations Count
60 to 79
All ages
80
Unknown Sex Hospitalizations
Expert Solution
This question has been solved!
Explore an expertly crafted, step-by-step solution for a thorough understanding of key concepts.

Step by step
Solved in 2 steps

Recommended textbooks for you
MATLAB: An Introduction with Applications
Statistics
ISBN:
9781119256830
Author:
Amos Gilat
Publisher:
John Wiley & Sons Inc

Probability and Statistics for Engineering and th…
Statistics
ISBN:
9781305251809
Author:
Jay L. Devore
Publisher:
Cengage Learning

Statistics for The Behavioral Sciences (MindTap C…
Statistics
ISBN:
9781305504912
Author:
Frederick J Gravetter, Larry B. Wallnau
Publisher:
Cengage Learning
MATLAB: An Introduction with Applications
Statistics
ISBN:
9781119256830
Author:
Amos Gilat
Publisher:
John Wiley & Sons Inc
Probability and Statistics for Engineering and th…
Statistics
ISBN:
9781305251809
Author:
Jay L. Devore
Publisher:
Cengage Learning
Statistics for The Behavioral Sciences (MindTap C…
Statistics
ISBN:
9781305504912
Author:
Frederick J Gravetter, Larry B. Wallnau
Publisher:
Cengage Learning

Elementary Statistics: Picturing the World (7th E…
Statistics
ISBN:
9780134683416
Author:
Ron Larson, Betsy Farber
Publisher:
PEARSON

The Basic Practice of Statistics
Statistics
ISBN:
9781319042578
Author:
David S. Moore, William I. Notz, Michael A. Fligner
Publisher:
W. H. Freeman

Introduction to the Practice of Statistics
Statistics
ISBN:
9781319013387
Author:
David S. Moore, George P. McCabe, Bruce A. Craig
Publisher:
W. H. Freeman