demanded equal, exceed, or fall short of quantity supplied? llowing L012.4 c. Suppose that buyers desire to purchase $200 billion of extra real output at each price level. Sketch in the new aggregate By what amount? demand curve as AD,. What are the new equilibriumsate Real GDP level and level of real output? 4. Suppose that the table presented below shows an economy's relationship between real output and the inputs needed to pro- 225 225 duce that output: LO12.4 225 Real GDP 225 Input Quantity 150.0 $400 in the t run? 112.5 300 75.0 200 ut per a. What is productivity in this economy? b. What is the per-unit cost of production if the price of each input unit is $2? c. Assume that the input price increases from $2 to $3 with no accompanying change in productivity. What is the new per- unit cost of production? In what direction would the $1 increase in input price push the economy's aggregate supply curve? What effect would this shift of aggregate supply have on the price level and the level of real output? d. Suppose that the increase in input price does not occur bul, instead, that productivity increases by 100 percent. What would be the new per-unit cost of production? What effect e new e new they apply e fol- of would this change in per-unit production cost have on the shift of aggregate supply have on the price level and the economy's ággregate supply curve? What effect would this level of real output? 5. Refer to the data in the table that accompanies problem 2. Suppose that the present equilibrium price level and level of real GDP are 100 and $225, and that data set B represents the and rice relevant aggregate By on of extra ng real output at each price level. Sketch in the new aggregate 12.4 c. Suppose that buyers de demand curve as AD,. What are the new equilibrium price 4. Suppose that the table presented below shows an economy's relationship between real output and the inputs needed to pro- al level and level of real output? duce that output: LO12.4 Real GDP Input Quantity $400 150.0 300 he n? 112.5 75.0 200 er a. What is productivity in this economy? b. What is the per-unit cost of production if the price of each input unit is $2? c. Assume that the input price increases from $2 to $3 with no accompanying change in productivity. What is the new per- unit cost of production? In what direction would the $1 increase in input price push the sconomy's aggregate supply curve? What effect would this shift of aggregate supply have on the price level and the level of real output? d. Suppose that the increase in input price does not occur but, instead, that productivity increases by 100 percent. What would be the new per-unit cost of production? What effect would this change in per-unit production cost have on the y economy's aggregate supply curve? What effect would this shift of aggregate supply have on the price level and the 5. Refer to the data in the table that accompanies problem 2. Suppose that the present equilibrium price level and level of level of real output? Tear GDP are 100 and $225, and that data set B represents te relevant aggregate supply schedule for the economy. a. What must be the cur L012.6
demanded equal, exceed, or fall short of quantity supplied? llowing L012.4 c. Suppose that buyers desire to purchase $200 billion of extra real output at each price level. Sketch in the new aggregate By what amount? demand curve as AD,. What are the new equilibriumsate Real GDP level and level of real output? 4. Suppose that the table presented below shows an economy's relationship between real output and the inputs needed to pro- 225 225 duce that output: LO12.4 225 Real GDP 225 Input Quantity 150.0 $400 in the t run? 112.5 300 75.0 200 ut per a. What is productivity in this economy? b. What is the per-unit cost of production if the price of each input unit is $2? c. Assume that the input price increases from $2 to $3 with no accompanying change in productivity. What is the new per- unit cost of production? In what direction would the $1 increase in input price push the economy's aggregate supply curve? What effect would this shift of aggregate supply have on the price level and the level of real output? d. Suppose that the increase in input price does not occur bul, instead, that productivity increases by 100 percent. What would be the new per-unit cost of production? What effect e new e new they apply e fol- of would this change in per-unit production cost have on the shift of aggregate supply have on the price level and the economy's ággregate supply curve? What effect would this level of real output? 5. Refer to the data in the table that accompanies problem 2. Suppose that the present equilibrium price level and level of real GDP are 100 and $225, and that data set B represents the and rice relevant aggregate By on of extra ng real output at each price level. Sketch in the new aggregate 12.4 c. Suppose that buyers de demand curve as AD,. What are the new equilibrium price 4. Suppose that the table presented below shows an economy's relationship between real output and the inputs needed to pro- al level and level of real output? duce that output: LO12.4 Real GDP Input Quantity $400 150.0 300 he n? 112.5 75.0 200 er a. What is productivity in this economy? b. What is the per-unit cost of production if the price of each input unit is $2? c. Assume that the input price increases from $2 to $3 with no accompanying change in productivity. What is the new per- unit cost of production? In what direction would the $1 increase in input price push the sconomy's aggregate supply curve? What effect would this shift of aggregate supply have on the price level and the level of real output? d. Suppose that the increase in input price does not occur but, instead, that productivity increases by 100 percent. What would be the new per-unit cost of production? What effect would this change in per-unit production cost have on the y economy's aggregate supply curve? What effect would this shift of aggregate supply have on the price level and the 5. Refer to the data in the table that accompanies problem 2. Suppose that the present equilibrium price level and level of level of real output? Tear GDP are 100 and $225, and that data set B represents te relevant aggregate supply schedule for the economy. a. What must be the cur L012.6

Chapter11: Managing Aggregate Demand: Fiscal Policy
Section: Chapter Questions
Problem 2TY

Related questions
Question
Transcribed Image Text:demanded equal, exceed, or fall short of quantity supplied?
llowing
L012.4
c. Suppose that buyers desire to purchase $200 billion of extra
real output at each price level. Sketch in the new aggregate
By what amount?
demand curve as AD,. What are the new equilibriumsate
Real
GDP
level and level of real output?
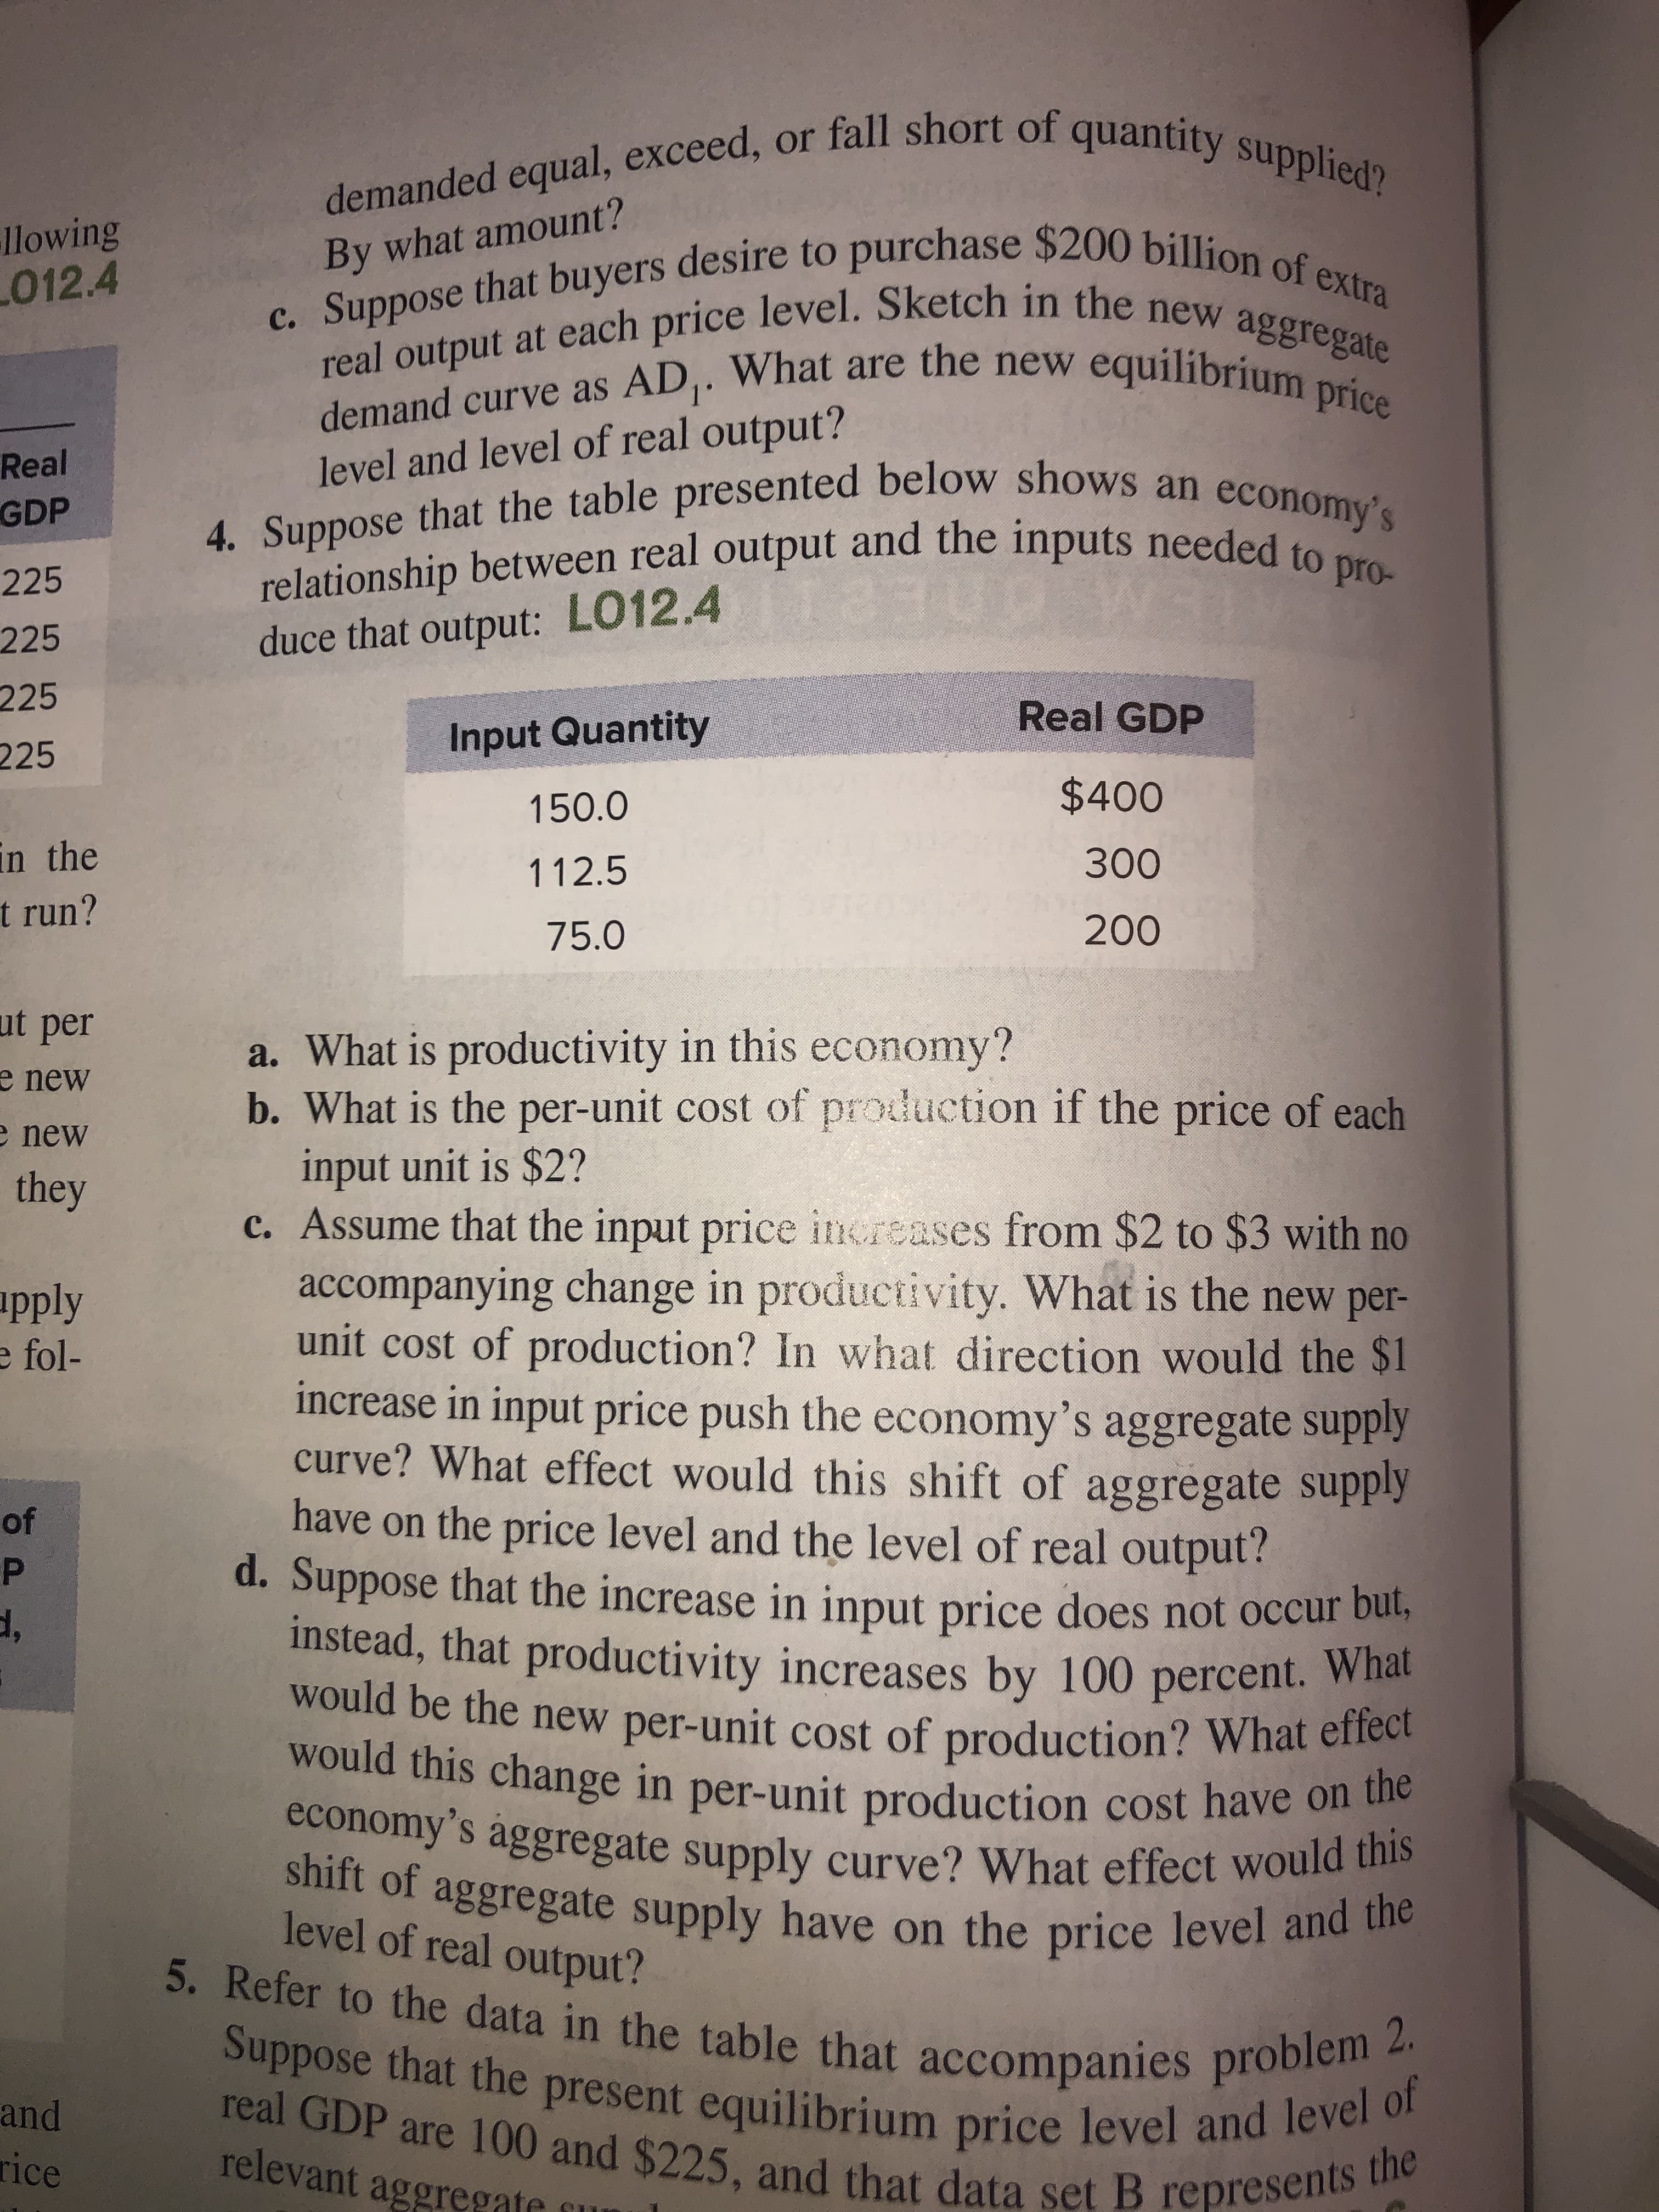
4. Suppose that the table presented below shows an economy's
relationship between real output and the inputs needed to pro-
225
225
duce that output: LO12.4
225
Real GDP
225
Input Quantity
150.0
$400
in the
t run?
112.5
300
75.0
200
ut per
a. What is productivity in this economy?
b. What is the per-unit cost of production if the price of each
input unit is $2?
c. Assume that the input price increases from $2 to $3 with no
accompanying change in productivity. What is the new per-
unit cost of production? In what direction would the $1
increase in input price push the economy's aggregate supply
curve? What effect would this shift of aggregate supply
have on the price level and the level of real output?
d. Suppose that the increase in input price does not occur bul,
instead, that productivity increases by 100 percent. What
would be the new per-unit cost of production? What effect
e new
e new
they
apply
e fol-
of
would this change in per-unit production cost have on the
shift of aggregate supply have on the price level and the
economy's ággregate supply curve? What effect would this
level of real output?
5. Refer to the data in the table that accompanies problem 2.
Suppose that the present equilibrium price level and level of
real GDP are 100 and $225, and that data set B represents the
and
rice
relevant aggregate
Transcribed Image Text:By
on of extra
ng
real output at each price level. Sketch in the new aggregate
12.4
c. Suppose that buyers de
demand curve as AD,. What are the new equilibrium price
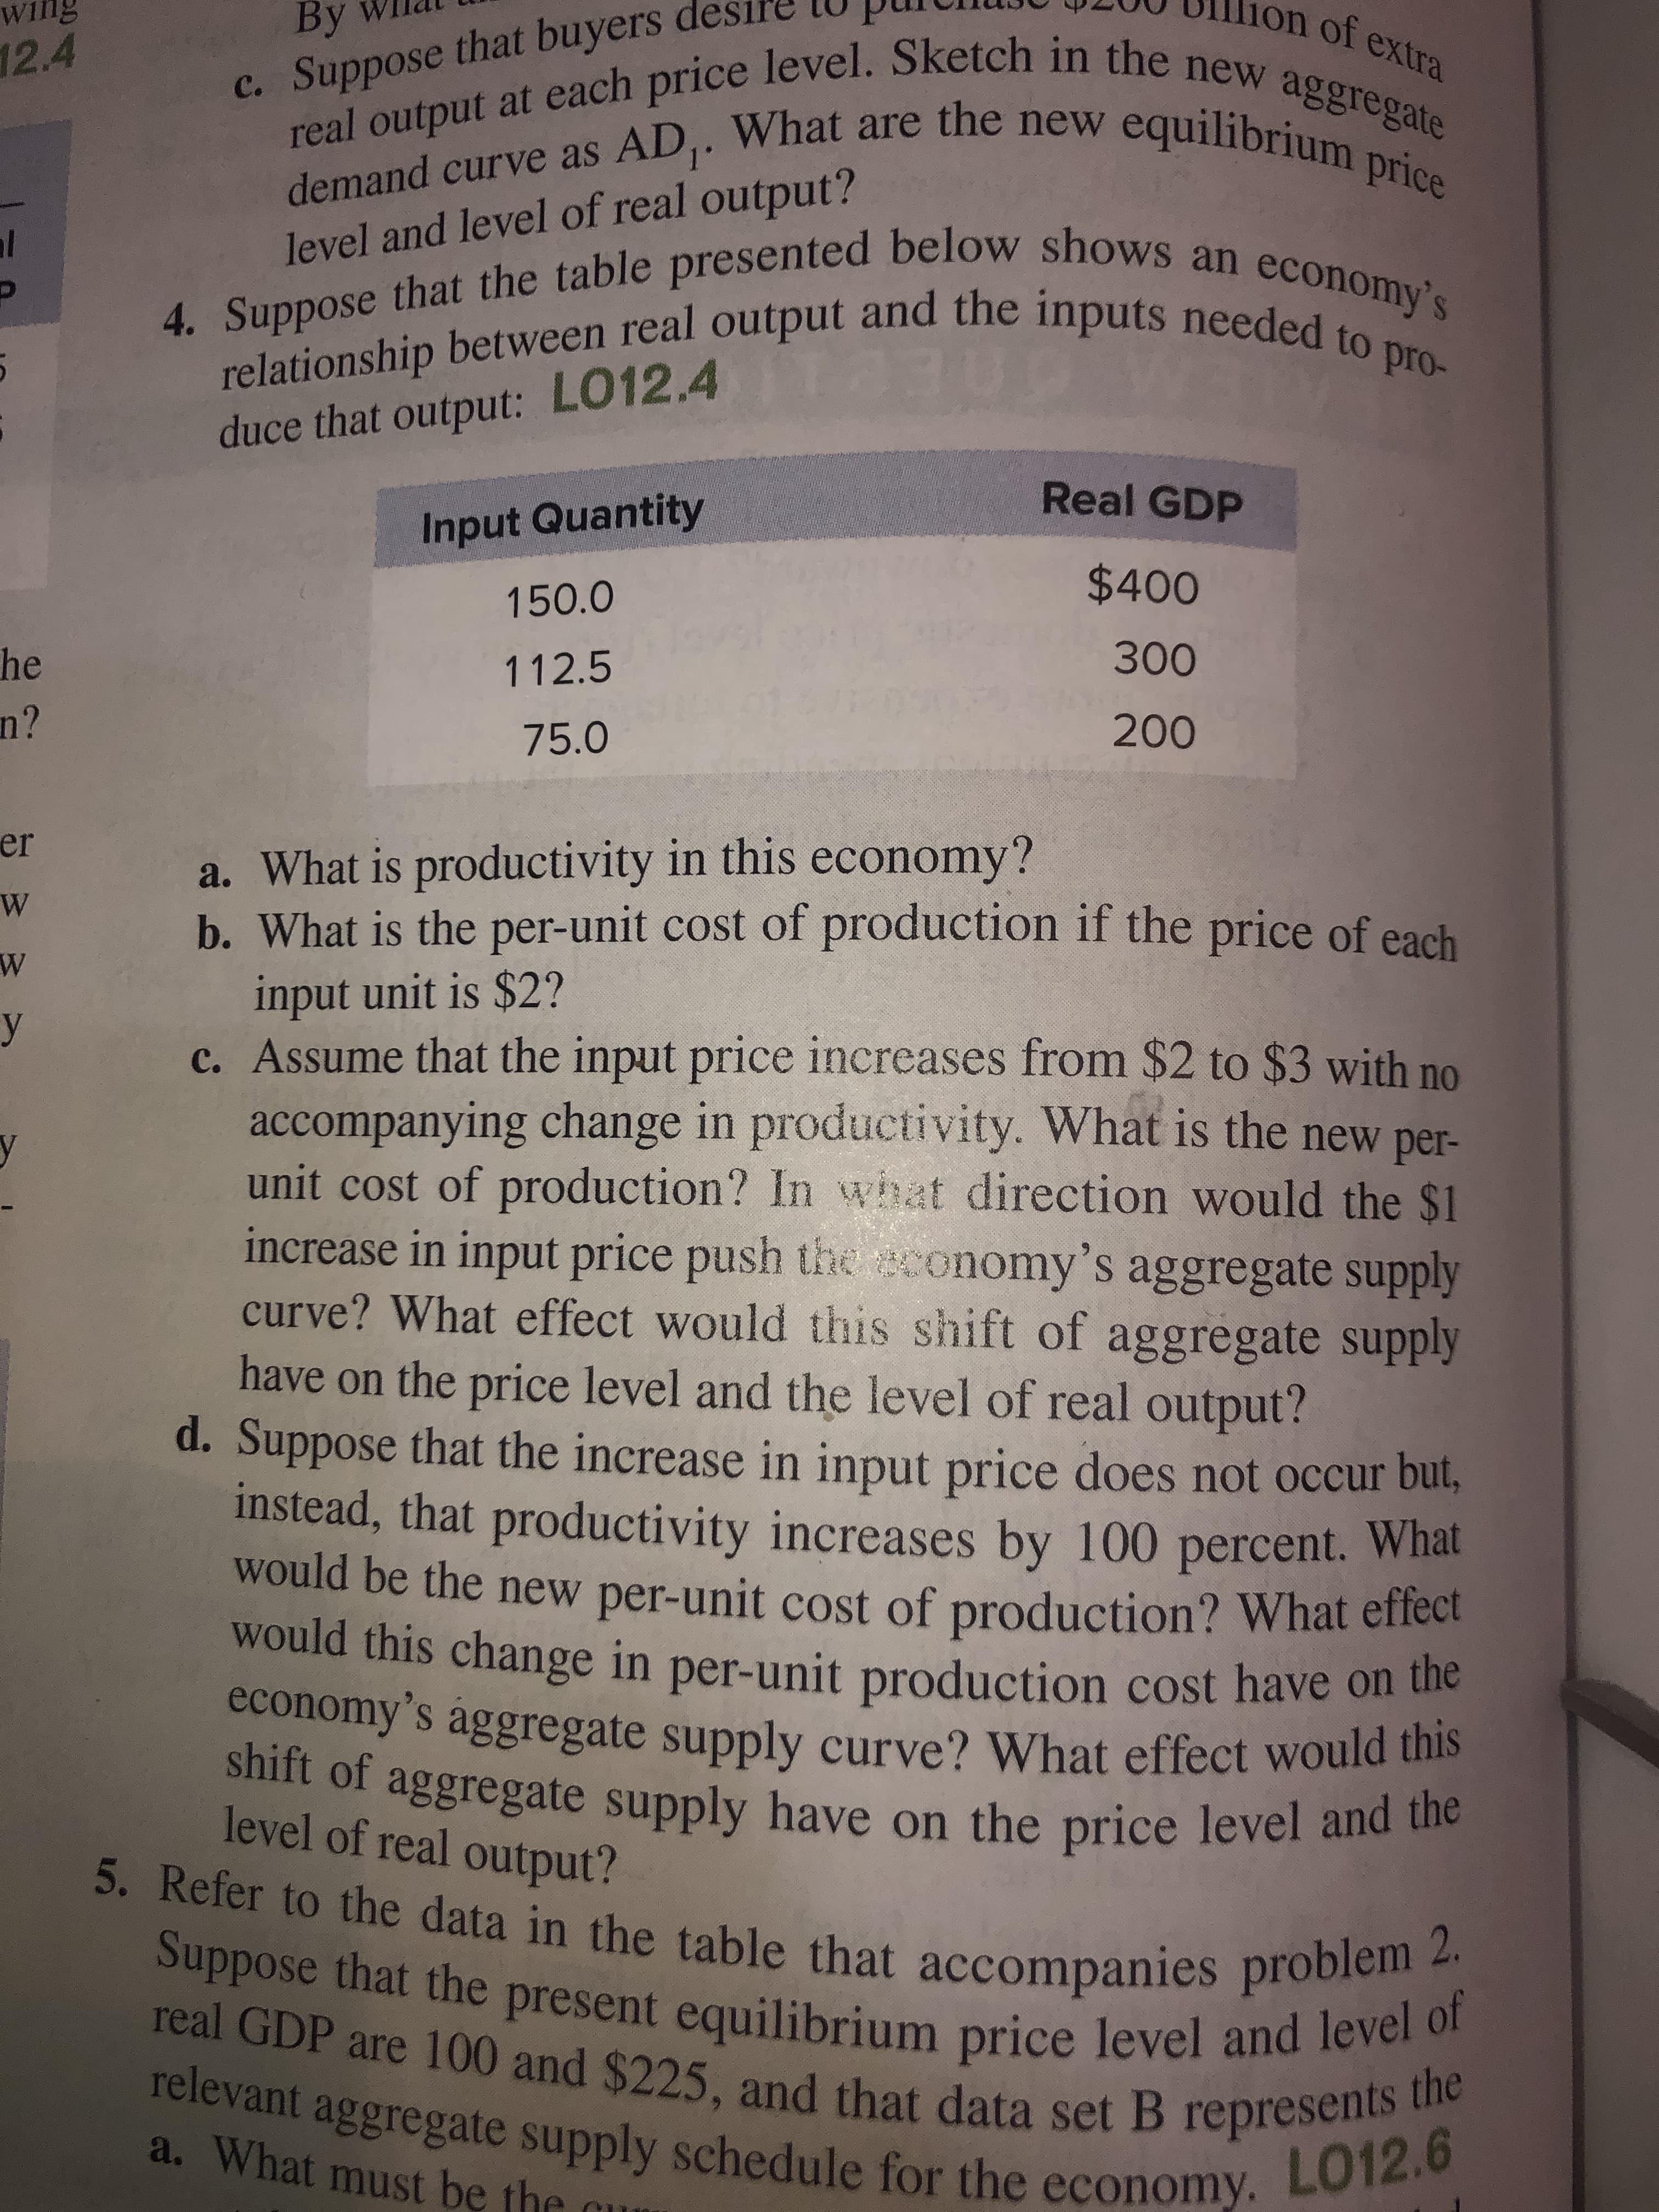
4. Suppose that the table presented below shows an economy's
relationship between real output and the inputs needed to pro-
al
level and level of real output?
duce that output: LO12.4
Real GDP
Input Quantity
$400
150.0
300
he
n?
112.5
75.0
200
er
a. What is productivity in this economy?
b. What is the per-unit cost of production if the price of each
input unit is $2?
c. Assume that the input price increases from $2 to $3 with no
accompanying change in productivity. What is the new per-
unit cost of production? In what direction would the $1
increase in input price push the sconomy's aggregate supply
curve? What effect would this shift of aggregate supply
have on the price level and the level of real output?
d. Suppose that the increase in input price does not occur but,
instead, that productivity increases by 100 percent. What
would be the new per-unit cost of production? What effect
would this change in per-unit production cost have on the
y
economy's aggregate supply curve? What effect would this
shift of aggregate supply have on the price level and the
5. Refer to the data in the table that accompanies problem 2.
Suppose that the present equilibrium price level and level of
level of real output?
Tear GDP are 100 and $225, and that data set B represents te
relevant aggregate supply schedule for the economy.
a. What must be the cur
L012.6
Expert Solution
This question has been solved!
Explore an expertly crafted, step-by-step solution for a thorough understanding of key concepts.

This is a popular solution!

Trending now
This is a popular solution!

Step by step
Solved in 5 steps with 5 images

Recommended textbooks for you


Brief Principles of Macroeconomics (MindTap Cours…
Economics
ISBN:
9781337091985
Author:
N. Gregory Mankiw
Publisher:
Cengage Learning
Brief Principles of Macroeconomics (MindTap Cours…
Economics
ISBN:
9781337091985
Author:
N. Gregory Mankiw
Publisher:
Cengage Learning

Principles of Economics (MindTap Course List)
Economics
ISBN:
9781305585126
Author:
N. Gregory Mankiw
Publisher:
Cengage Learning

Principles of Macroeconomics (MindTap Course List)
Economics
ISBN:
9781285165912
Author:
N. Gregory Mankiw
Publisher:
Cengage Learning

Principles of Macroeconomics (MindTap Course List)
Economics
ISBN:
9781305971509
Author:
N. Gregory Mankiw
Publisher:
Cengage Learning