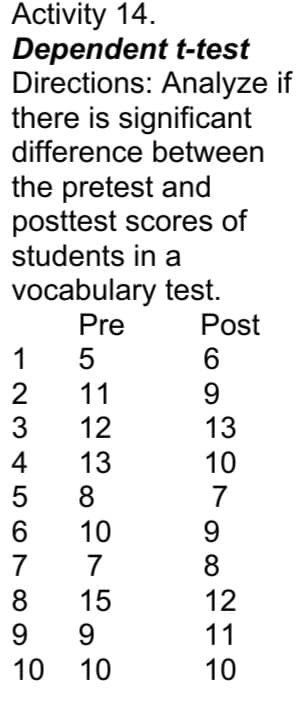
Dependent t-test Directions: Analyze if there is significant difference between the pretest and posttest scores of students in a


Q: Ten cars were equipped with radial tires and driven over a test course. Then the same 10 cars (with…
A: Solution: Let x = T1 ( Radial ) and y = T2 (belted ) x y d= x-y (d-d) (d-d)2 4.2 4.1 0.1…
Q: 3. Gender-orientation of smells. Some smells are perceived as being more feminine or more masculine.…
A:
Q: Test Score 90 80 60 50 15 SCATTER PLOT A Scatterplot of Test Score vs Self Learning Time 25 30 Self…
A: I will answer the question in next step
Q: The VA has collected the past month’s data from sixteen hospitals. The VA believed the selected…
A: Thanks for giving opportunity to serve for bartleby students, Hey, There ! Thank you for posting…
Q: The t Stat is a measure of how an individual independent variable explains variation in the…
A: Solution
Q: Independent t-test. Directions: Analyze if there is significant difference between the two sets of…
A: Hello! As you have posted 2 different questions, we are answering the first question. In case you…
Q: the booster. Test the effectiveness of the octane booster at a=0.05. Assume that the normality…
A: Given, A researcher wanted to determine if using an octane booster would increase gasoline mileage.…
Q: A pediatrician wants to determine the relation that exists between a child's height, x, and head…
A: The equation of the line is given by,
Q: Ackerman and Goldsmith (2011) compared lear performance for students who studied material printed on…
A: a) Dependent and independent variable: The variable of interest, regarding which, the prediction is…
Q: Fill in the blank and choose between the options within the brackets that align with the residual…
A: From residual plot we see that, points below and above central line are randomly scattered and does…
Q: Let us measure the degree of relationship between the performar inees during the third and fourth…
A: Given data is :
Q: A pediatrician wants to determine the relation that exists between a child's height, x, and head…
A: Obtain the regression equation. From the information, given that Let X denotes the height in…
Q: Sketch by hand a scatterplot of the number of uninsured people in 2007 (as the response variable)…
A: Given Information: Consider the data that shows the number of uninsured people from a survey of…
Q: Adam intends to conduct a certain statistical analysis to analyze the data he collected from a field…
A: Factors That Affect Power The power of a hypothesis test is affected by the following factors:…
Q: In linear regression, the dependent variables are the O a. Regressors |b. Responses O. Fitted…
A: In linear regression, the independent variable is x. The dependent variable is y. We have to write…
Q: a) Draw a scatter diagram for the above data and interpret the relationship between the two…
A: Followings are the Explanation of the Question a) Use the Excel and draw the Scatterplot Followings…
Q: The scatter plot below shows the average cost of a designer jacket in a sample of years between 2000…
A: Given, The regression equation is Y = −4815+ 3.765 X.
Q: Strawberries The following data were obtained in an experiment relating the dependent variable,…
A: Since you have asked multiple questions, we will solve the first question for you. If you want any…
Q: i. Find the equation of least squares regression line, ŷ = a + bx. ii. Find the linear correlation…
A:
Q: The table lists the average tuition and fees at private colleges and universities for selected years…
A: The given data set is: Year(x) Fees(y) x2 y2 xy 1985 5418 3940225 29354724…
Q: The output below attempts to predict the salary an accountant makes. What is the predicted salary…
A:
Q: Researchers studied the effect of a houseplant fertilizer on carrot sprout growth. They randomly…
A: To test, the effect of a houseplant fertilizer on carrot sprout growth. Here we use independent two…
Q: tical! ne the critical value and illustrate the rejection mal curve by using the given information.…
A: According to guideline we solve only first question when given questions are different.
Q: he scatter plot below shows the average cost of a designer jacket in a sample of years between 2000…
A:
Q: Calculate coefficient of skewness on the basis of quartile values for the distributic interpret the…
A: The degree of skewness can be measured in both absolute and relative measures. Mean = Mode…
Q: Waterbury Insurance Company wants to study the relationship between the amount of fire damage and…
A: Given...... Waterbury Insurance Company wants to study the relationship between the amount of fire…
Q: Perform at-test (signiticance level a - 0.05) to test your null hypothesis and compare diastolic…
A: Introduction: To tests, the equality of the two population means we can use the two-sample t-test.…
Q: The scatter plot below shows the average cost of a designer jacket in a sample of years between 2000…
A: Given least square regression line y^ = -4815 + 3.765x.It is to estimate the average cost of…
Q: This model regresses Salary in a financial services company onto education Q3: [educ) measured as…
A:
Q: Marks obtained by students in a Chemistry test was adjusted because of an error in one of the…
A: SolutionGiven marks obtained by student in a chemistry test was adjusted .
Q: the regression line for the data points. x y 1 2 2 5 3 9 4 11 y' =
A: Solution:Straight line equation is y=a+bx.The normal equations are∑y=an+b∑x∑xy=a∑x+b∑x2The values…
Q: student used multiple regression analysis to study how family spending (y) is influenced by income…
A: d. The hypotheses are; H0: β3 = 0 Ha: β3 ≠ 0 The test statistic is,
Q: a. Draw a scatter diagram for the data. b. Draw a regression line of y on x. c. Determine the…
A: a) The linear model obtained using scatter diagram is given below: The line that best fits the data…
Q: Which of these is not an assumption of the z test? a. The dependent variable is measured on a scale…
A: Followings are the Explanation of the question Z - test:- When the Population standard deviation…
Q: Classify the data as either discrete or continuous. The average speed of cars passing a busy…
A:
Q: estion 7 of 15 Suppose the manager of a gas station monitors how many bags of ice he sells daily…
A: Given data: The least square regression line of the data is ; Y-cap = -114.05 + 2.17x
Q: You wonder whether talking to plants keeps them from dying. You conduct a study in which you talk to…
A: Given: You wonder whether talking to plants keeps them from dying. You conduct a study in which you…
Q: writing a null hypothesis for the bivariate relationship shown in the SPSS ou
A: Given:
Q: 5. The module in social science for grade 12 students were created by the teachers of Filemon T.…
A: Denote μ1, μ2 as the true average scores for pre and post tests, respectively.
Q: A multiple regression model involved 10 independent variables (p) and 140 observations (n). The…
A: Hello. Since your question has multiple, we will solve first question for you. If you want remaining…
Q: Was a dependent or independent t-test used to analyze the data? How do you know?
A: Solution: Dependent or paired t test: The dependent t test or paired t test can be used to…
Q: Waterbury Insurance Company wants to study the relationship between the amount of fire damage and…
A: Note : Since you have posted a question with multiple sub-parts, we will solve first three subparts…
Q: A student used multiple regression analysis to study how family spending (y) is influenced by income…
A: 1. Considering the providing data, the estimated regression equation for the relationship between…
Q: (c) Runge-Kutta method Compare the %error of the estimate values of (d). Show complete solutio
A: answer is in next step
Q: Quèstion 14 For the data set Frequency 2. Class 0-9 10- 19 3. 20-29 30-39 40-49 The first quartile…
A: The cumulative frequency is obtained below: Class Frequency cf 0-9 2 2 10-19…
Q: The relative error is Blank 1.
A:
Q: mpoqui2_start_frame_auto.d2l?ou=262028isprv3&drc%3D0&qi=408225&cfql=0&dnb=0&fromQB=0 * The boxplot…
A: From the given box plot we find the solution.
Q: llustration 9.33. The following data represent travel expenses ( 'her than transportation) for 7…
A:
Q: In bivariate regression, the value of Y when X equals 0 is: Group of answer choices Intercept (b0)…
A:

Step by step
Solved in 2 steps with 1 images

- A new vaccination is being used in a laboratory experiment to investigate whether it is effective. There are 277277 subjects in the study. Is there sufficient evidence to determine if vaccination and disease status are related? Vaccination Status Diseased Not Diseased Total Vaccinated 7474 3030 104104 Not Vaccinated 5151 122122 173173 Total 125125 152152 277277 Copy Data Step 5 of 8 : Find the degrees of freedom associated with the test statistic for this problem.An experiment was conducted to test whether students’ performance (above or below average) is independent of stress level as a result of pressure on time table for the term in Hwanhwan Senior High School. The table below gives a 3 × 2 contingency table of the sample. Above Average Average Below Average Total Stressed 135 250 285 670 Not Stressed 150 157 107 414 Total 285 407 392 1084 With the help of chi-square test statistics, determine whether students' performance for the selected term in the school is independent of their stressed level experienced from the time table at α = 0.05The following table gives the number of parking tickets obtained in a semester and the GPAs of 77 randomly selected drivers. Number of Tickets 0 1 2 3 4 7 8 GPA 5.5 5 4.5 4 3 2 1.5 Copy Data Determine if r is statistically significant at the 0.010.01 level. Yes or no?
- A pharmaceutical company is running a test comparing two forms of advertising for the same product one which involved a television campaign and the other a print campaign. Market sectors are randomly assigned to receive a particular form of advertising and product sales are recorded during the month following ad campaigns. Using the data provided test if there is a significant difference in product sales by method of advertisement. Use (alpha) a=0.05We examine the relationship between gender and fear of walking at night in their neighborhood (FEAR) based on GSS 2014 data. Afraid to walk at night Men Women Total Yes 77 175 252 No 270 259 529 Total 347 434 781 (1) What is the number of degrees of freedom for this table? (2) Test the null hypothesis that gender and fear of waling alone are independent (alpha = .05). What do you conclude?A paper investigated the driving behavior of teenagers by observing their vehicles as they left a high school parking lot and then again at a site approximately 1 2 mile from the school. Assume that it is reasonable to regard the teen drivers in this study as representative of the population of teen drivers. Amount by Which Speed Limit Was Exceeded MaleDriver FemaleDriver 1.3 -0.1 1.3 0.4 0.9 1.1 2.1 0.7 0.7 1.1 1.3 1.2 3 0.1 1.3 0.9 0.6 0.5 2.1 0.5 (a) Use a .01 level of significance for any hypothesis tests. Data consistent with summary quantities appearing in the paper are given in the table. The measurements represent the difference between the observed vehicle speed and the posted speed limit (in miles per hour) for a sample of male teenage drivers and a sample of female teenage drivers. (Use μmales − μfemales.Round your test statistic to two decimal places. Round your degrees of freedom down to the nearest whole number. Round your p-value to…
- The data in the attached image represents blood pressure based on a new trial medication used in an experiment involving a total of 50 male and female subjects. There were two levels of treatment: 0 = placebo and 1 = treatment group. Family History Blood Pressure = Fam-Hist-BP; from the paternal side = PS; from the maternal side = MS; from both sides = BS; none on both sides or not known = N.; Blood pressure before the experiment = BP-Before-Exp; Blood pressure after the experiment = BP-After-Exp. Task: Construct a side-by-side boxplot to compare the variables BP-Before-Exp and BP-After-Exp.The data in the attached image represents blood pressure based on a new trial medication used in an experiment involving a total of 50 male and female subjects. There were two levels of treatment: 0 = placebo and 1 = treatment group. Family History Blood Pressure = Fam-Hist-BP; from the paternal side = PS; from the maternal side = MS; from both sides = BS; none on both sides or not known = N.; Blood pressure before the experiment = BP-Before-Exp; Blood pressure after the experiment = BP-After-Exp. Task: Construct a scatterplot to display the relationship and find the correlation between age and BP-Before Exp.The data in the attached image represents blood pressure based on a new trial medication used in an experiment involving a total of 50 male and female subjects. There were two levels of treatment: 0 = placebo and 1 = treatment group. Family History Blood Pressure = Fam-Hist-BP; from the paternal side = PS; from the maternal side = MS; from both sides = BS; none on both sides or not known = N.; Blood pressure before the experiment = BP-Before-Exp; Blood pressure after the experiment = BP-After-Exp. Task: Construct a histogram to represent the family BP history, the subjects' BP before treatment and the subjects' BP after treatment.
- The data in the attached image represents blood pressure based on a new trial medication used in an experiment involving a total of 50 male and female subjects. There were two levels of treatment: 0 = placebo and 1 = treatment group. Family History Blood Pressure = Fam-Hist-BP; from the paternal side = PS; from the maternal side = MS; from both sides = BS; none on both sides or not known = N.; Blood pressure before the experiment = BP-Before-Exp; Blood pressure after the experiment = BP-After-Exp. Task: Construct a scatterplot to display the relationship and find the correlation between BP-Before-Exp and BP-After-Exp.Exercises pertain to critical values for a Wilcoxon signed-rank test. Use Table V in Appendix A to determine the critical value(s) in each case. For a left-tailed or two-tailed test, you will also need the relation W1−A = n(n + 1)/2 − WA. Sample size = 19; Significance level = 0.10 a. Right tailed b. Left tailed c. Two tailedA paper investigated the driving behavior of teenagers by observing their vehicles as they left a high school parking lot and then again at a site approximately 1 2 mile from the school. Assume that it is reasonable to regard the teen drivers in this study as representative of the population of teen drivers. Amount by Which Speed Limit Was Exceeded MaleDriver FemaleDriver 1.2 -0.1 1.4 0.4 0.9 1.1 2.1 0.7 0.7 1.1 1.3 1.2 3 0.1 1.3 0.9 0.6 0.5 2.1 0.5 (a) Use a .01 level of significance for any hypothesis tests. Data consistent with summary quantities appearing in the paper are given in the table. The measurements represent the difference between the observed vehicle speed and the posted speed limit (in miles per hour) for a sample of male teenage drivers and a sample of female teenage drivers. (Use μmales − μfemales.Round your test statistic to two decimal places. Round your degrees of freedom down to the nearest whole number. Round your p-value to…