Describe the trends in the graph showing the number of births each year in a small town. Number of Births 24 22 20 18 16 14 12 10 6- 2000 2002 2004 2006 2008 2010 U a) The number of births is constant from 2001 to 2007. b) From 2001 to 2005, the number of births is constant. From 2006 to 2007 the number of births decreases steadily. From 2001 to 2003, the number of births increases steadily. O c) From 2004 to 2007, the number of births decreases steadily. From 2001 to 2002, the number of births is constant. d) In 2003, the number of births increases sharply. The number of births is roughly constant from 2003 to 2006. In 2007, the number of births decreases sharply.
Describe the trends in the graph showing the number of births each year in a small town. Number of Births 24 22 20 18 16 14 12 10 6- 2000 2002 2004 2006 2008 2010 U a) The number of births is constant from 2001 to 2007. b) From 2001 to 2005, the number of births is constant. From 2006 to 2007 the number of births decreases steadily. From 2001 to 2003, the number of births increases steadily. O c) From 2004 to 2007, the number of births decreases steadily. From 2001 to 2002, the number of births is constant. d) In 2003, the number of births increases sharply. The number of births is roughly constant from 2003 to 2006. In 2007, the number of births decreases sharply.

Glencoe Algebra 1, Student Edition, 9780079039897, 0079039898, 2018
18th Edition
ISBN:9780079039897
Author:Carter
Publisher:Carter
Chapter2: Linear Equations
Section: Chapter Questions
Problem 2PFA

Related questions
Question
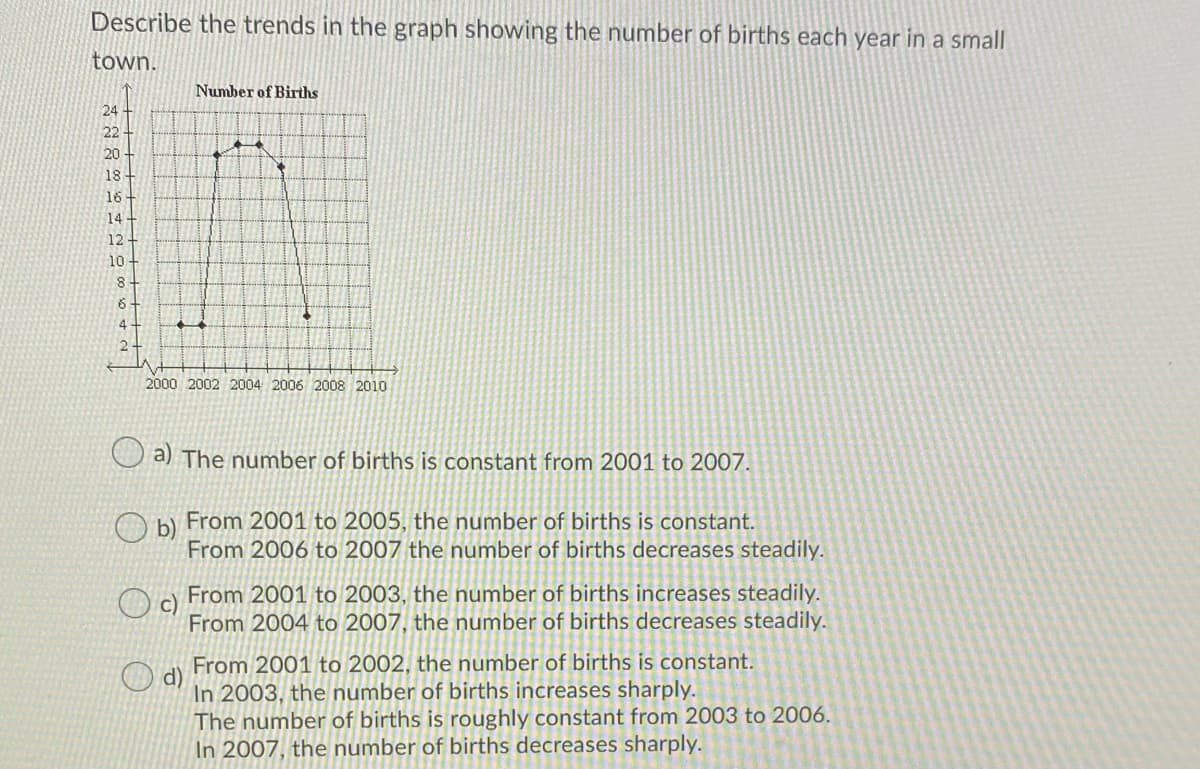
Transcribed Image Text:Describe the trends in the graph showing the number of births each year in a small
town.
Number of Births
24
22
20
18
16
14
12
10
2000 2002 2004 2006 2008 2010
O a) The number of births is constant from 2001 to
007.
From 2001 to 2005, the number of births is constant.
O b)
From 2006 to 2007 the number of births decreases steadily.
From 2001 to 2003, the number of births increases steadily.
From 2004 to 2007, the number of births decreases steadily.
From 2001 to 2002, the number of births is constant.
In 2003, the number of births increases sharply.
The number of births is roughly constant from 2003 to 2006.
In 2007, the number of births decreases sharply.
Expert Solution
This question has been solved!
Explore an expertly crafted, step-by-step solution for a thorough understanding of key concepts.

Step by step
Solved in 2 steps with 2 images

Recommended textbooks for you
Glencoe Algebra 1, Student Edition, 9780079039897…
Algebra
ISBN:
9780079039897
Author:
Carter
Publisher:
McGraw Hill


Glencoe Algebra 1, Student Edition, 9780079039897…
Algebra
ISBN:
9780079039897
Author:
Carter
Publisher:
McGraw Hill

Algebra & Trigonometry with Analytic Geometry
Algebra
ISBN:
9781133382119
Author:
Swokowski
Publisher:
Cengage