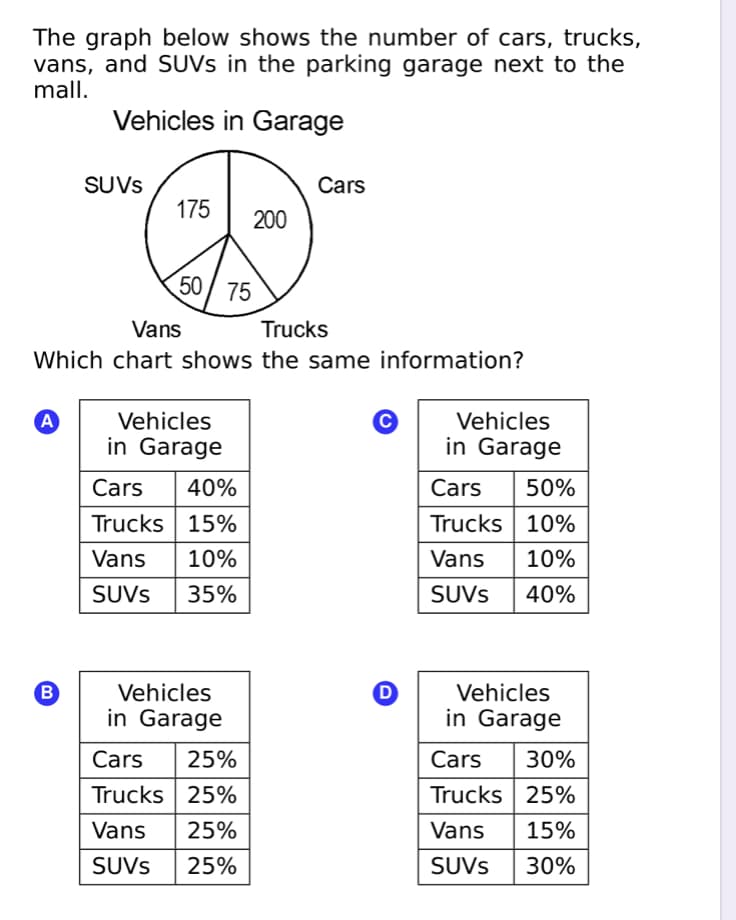
The graph below shows the number of cars, trucks, vans, and SUVS in the parking garage next to the mall. Vehicles in Garage SUVS Cars 175 200 50/ 75 Vans Trucks Which chart shows the same information? A Vehicles Vehicles in Garage in Garage Cars 40% Cars 50% Trucks 15% Trucks 10% Vans 10% Vans 10% SUVS 35% SUVS 40% B Vehicles Vehicles in Garage in Garage Cars 25% Cars 30% Trucks 25% Trucks 25% Vans 25% Vans 15% SUVS 25% SUVS 30%
The graph below shows the number of cars, trucks, vans, and SUVS in the parking garage next to the mall. Vehicles in Garage SUVS Cars 175 200 50/ 75 Vans Trucks Which chart shows the same information? A Vehicles Vehicles in Garage in Garage Cars 40% Cars 50% Trucks 15% Trucks 10% Vans 10% Vans 10% SUVS 35% SUVS 40% B Vehicles Vehicles in Garage in Garage Cars 25% Cars 30% Trucks 25% Trucks 25% Vans 25% Vans 15% SUVS 25% SUVS 30%

Glencoe Algebra 1, Student Edition, 9780079039897, 0079039898, 2018
18th Edition
ISBN:9780079039897
Author:Carter
Publisher:Carter
Chapter10: Statistics
Section10.6: Summarizing Categorical Data
Problem 25PPS

Related questions
Question
Show work
Transcribed Image Text:The graph below shows the number of cars, trucks,
vans, and SUVS in the parking garage next to the
mall.
Vehicles in Garage
SUVS
Cars
175
200
50/ 75
Vans
Trucks
Which chart shows the same information?
A
Vehicles
Vehicles
in Garage
in Garage
Cars
40%
Cars
50%
Trucks 15%
Trucks 10%
Vans
10%
Vans
10%
SUVS
35%
SUVS
40%
B
Vehicles
Vehicles
in Garage
in Garage
Cars
25%
Cars
30%
Trucks 25%
Trucks 25%
Vans
25%
Vans
15%
SUVS
25%
SUVS
30%
Expert Solution
This question has been solved!
Explore an expertly crafted, step-by-step solution for a thorough understanding of key concepts.

Step by step
Solved in 2 steps with 1 images

Recommended textbooks for you
Glencoe Algebra 1, Student Edition, 9780079039897…
Algebra
ISBN:
9780079039897
Author:
Carter
Publisher:
McGraw Hill
Glencoe Algebra 1, Student Edition, 9780079039897…
Algebra
ISBN:
9780079039897
Author:
Carter
Publisher:
McGraw Hill