Dr. Lillian Fok, a New Orleans psychologist, specializes in treating patients who are agoraphobic (i.e., afraid to leave their homes). The following table indicates how many patients Dr. Fok has seen each year for the past 10 years. It also indicates what the robbery rate was in New Orleans during the same year: Year Number of Patients Robbery Rate per 1,000 Population The simple linear regression equation that shows the best relationship between the number of patients and year is (round your responses to three decimal places): 1 37 57.8 2 32 61.1 3 4 41 42 73.4 75.2 where y = Dependent Variable and x = Independent Variable. Using linear regression, the number of patients Dr. Fok will see in year 11 = Using linear regression, the number of patients Dr. Fok will see in year 12 = 5 42 78.5 X 6 7 8 9 10 54 58 53 57 61 89.5 99.6 94.2 102.2 116.2 patients (round your response to two decimal places). patients (round your response to two decimal places). The coefficient of determination for the linear regression model is 0.8714. This shows that there is a and "Year." strong relationship between the "Number of Patients" not so strong
Dr. Lillian Fok, a New Orleans psychologist, specializes in treating patients who are agoraphobic (i.e., afraid to leave their homes). The following table indicates how many patients Dr. Fok has seen each year for the past 10 years. It also indicates what the robbery rate was in New Orleans during the same year: Year Number of Patients Robbery Rate per 1,000 Population The simple linear regression equation that shows the best relationship between the number of patients and year is (round your responses to three decimal places): 1 37 57.8 2 32 61.1 3 4 41 42 73.4 75.2 where y = Dependent Variable and x = Independent Variable. Using linear regression, the number of patients Dr. Fok will see in year 11 = Using linear regression, the number of patients Dr. Fok will see in year 12 = 5 42 78.5 X 6 7 8 9 10 54 58 53 57 61 89.5 99.6 94.2 102.2 116.2 patients (round your response to two decimal places). patients (round your response to two decimal places). The coefficient of determination for the linear regression model is 0.8714. This shows that there is a and "Year." strong relationship between the "Number of Patients" not so strong

Practical Management Science
6th Edition
ISBN:9781337406659
Author:WINSTON, Wayne L.
Publisher:WINSTON, Wayne L.
Chapter11: Simulation Models
Section: Chapter Questions
Problem 62P: An automobile manufacturer is considering whether to introduce a new model called the Racer. The...

Related questions
Question
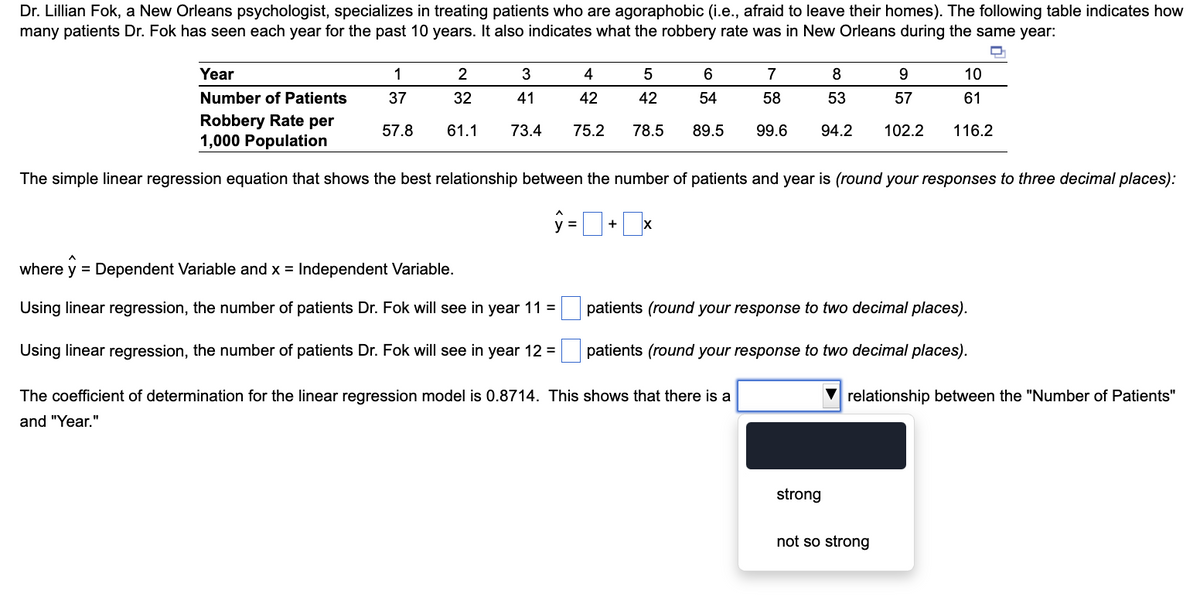
Dr. Lillian Fok, a New Orleans psychologist, specializes in treating patients who are agoraphobic (i.e., afraid to leave their homes). The following table indicates how many patients Dr. Fok has seen each year for the past 10 years. It also indicates what the robbery rate was in New Orleans during the same year:
|
Year
|
1
|
2
|
3
|
4
|
5
|
6
|
7
|
8
|
9
|
10
|
|
Number of Patients
|
37
|
32
|
41
|
42
|
42
|
54
|
58
|
53
|
57
|
61
|
|
Robbery Rate per 1,000 Population
|
57.8
|
61.1
|
73.4
|
75.2
|
78.5
|
89.5
|
99.6
|
94.2
|
102.2
|
116.2
|
Part 2
The simple linear regression equation that shows the best relationship between the number of patients and year is (round your responses to three decimal places):
y
=
enter your response here
+
enter your response herex
where
y
= Dependent Variable and x = Independent Variable.Part 3
Using linear
regression,
the number of patients Dr. Fok will see in year
11
=
enter your response here
patients (round your response to two decimal places).Part 4
Using linear
regression,
the number of patients Dr. Fok will see in year
12
=
enter your response here
patients (round your response to two decimal places).Part 5
The coefficient of determination for the linear regression model is
relationship between the "Number of Patients" and "Year."
0.8714.
This shows that there is a
▼
strong
not so strong
Transcribed Image Text:Dr. Lillian Fok, a New Orleans psychologist, specializes in treating patients who are agoraphobic (i.e., afraid to leave their homes). The following table indicates how
many patients Dr. Fok has seen each year for the past 10 years. It also indicates what the robbery rate was in New Orleans during the same year:
Year
Number of Patients
Robbery Rate per
1,000 Population
1
2
3
4
37
32
41
42
57.8 61.1 73.4 75.2
5
42
78.5
where y = Dependent Variable and x = Independent Variable.
Using linear regression, the number of patients Dr. Fok will see in year 11 =
Using linear regression, the number of patients Dr. Fok will see in year 12 =
6
7
8
9
10
54
58
53
57
61
89.5 99.6 94.2 102.2 116.2
The simple linear regression equation that shows the best relationship between the number of patients and year is (round your responses to three decimal places):
ŷ=+x
patients (round your response to two decimal places).
patients (round your response to two decimal places).
The coefficient of determination for the linear regression model is 0.8714. This shows that there is a
and "Year."
strong
relationship between the "Number of Patients"
not so strong
Expert Solution
This question has been solved!
Explore an expertly crafted, step-by-step solution for a thorough understanding of key concepts.

This is a popular solution!

Trending now
This is a popular solution!

Step by step
Solved in 3 steps with 2 images

Recommended textbooks for you
Practical Management Science
Operations Management
ISBN:
9781337406659
Author:
WINSTON, Wayne L.
Publisher:
Cengage,

Practical Management Science
Operations Management
ISBN:
9781337406659
Author:
WINSTON, Wayne L.
Publisher:
Cengage,