e) If a female salesperson told you that she has a 2-year college degree, what is your prediction on her annual income? Cor the
e) If a female salesperson told you that she has a 2-year college degree, what is your prediction on her annual income? Cor the

Chapter4: Linear Functions
Section4.3: Fitting Linear Models To Data
Problem 24SE: Table 6 shows the year and the number ofpeople unemployed in a particular city for several years....

Related questions
Question
Transcribed Image Text:QUESTION 13
e) If a female salesperson told you that she has a 2-year college degree, what is your prediction on her annual income?
For the toolbar, press ALT+F10 (PC) or ALT+FN+F10 (Mac).
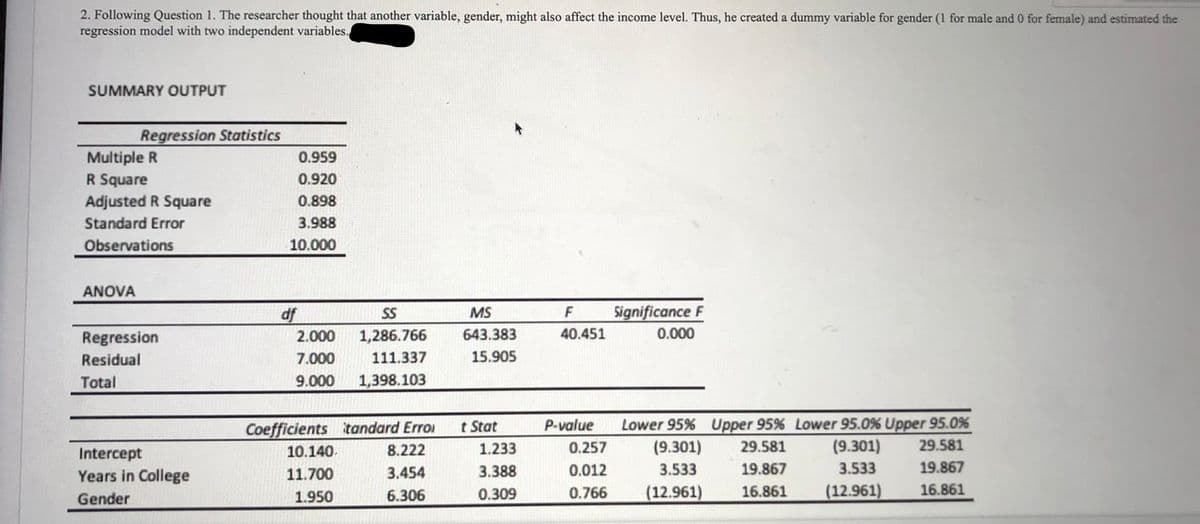
Transcribed Image Text:2. Following Question 1. The researcher thought that another variable, gender, might also affect the income level. Thus, he created a dummy variable for gender (1 for male and 0 for female) and estimated the
regression model with two independent variables,
SUMMARY OUTPUT
Regression Statistics
Multiple R
R Square
0.959
0.920
Adjusted R Square
0.898
Standard Error
3.988
Observations
10.000
ANOVA
df
SS
MS
F
Significance F
Regression
2.000
1,286.766
643.383
40.451
0.000
Residual
7.000
111.337
15.905
Total
9.000
1,398.103
Lower 95% Upper 95% Lower 95.0% Upper 95.0%
(9.301)
Coefficients itandard Erro
t Stat
P-value
10.140.
8.222
1.233
0.257
29.581
(9.301)
29.581
Intercept
Years in College
11.700
3.454
3.388
0.012
3.533
19.867
3.533
19.867
1.950
6.306
0.309
0.766
(12.961)
16.861
(12.961)
16.861
Gender
Expert Solution
This question has been solved!
Explore an expertly crafted, step-by-step solution for a thorough understanding of key concepts.

Step by step
Solved in 2 steps

Recommended textbooks for you

College Algebra
Algebra
ISBN:
9781305115545
Author:
James Stewart, Lothar Redlin, Saleem Watson
Publisher:
Cengage Learning

Mathematics For Machine Technology
Advanced Math
ISBN:
9781337798310
Author:
Peterson, John.
Publisher:
Cengage Learning,
College Algebra
Algebra
ISBN:
9781305115545
Author:
James Stewart, Lothar Redlin, Saleem Watson
Publisher:
Cengage Learning
Mathematics For Machine Technology
Advanced Math
ISBN:
9781337798310
Author:
Peterson, John.
Publisher:
Cengage Learning,

Algebra & Trigonometry with Analytic Geometry
Algebra
ISBN:
9781133382119
Author:
Swokowski
Publisher:
Cengage