The following data on r = the line speed (feet per minute) and y = the number of defective parts found for a production process at Brawdy Plastics provided the estimated regression equation ŷ = 27.5 – 0.3x. Excel File: data14-37.xlsx Number of Defective Line Speed Parts Found 20 23 20 21 30 19 30 16 40 15 40 17 50 14 50 11 For these data SSE = 16 Develop a 95% confidence interval for the mean number of defective parts for a line speed of 25 feet per minute (to 4 decimals). Use Table 1 of Appendix B. 29.895 to 29.895
The following data on r = the line speed (feet per minute) and y = the number of defective parts found for a production process at Brawdy Plastics provided the estimated regression equation ŷ = 27.5 – 0.3x. Excel File: data14-37.xlsx Number of Defective Line Speed Parts Found 20 23 20 21 30 19 30 16 40 15 40 17 50 14 50 11 For these data SSE = 16 Develop a 95% confidence interval for the mean number of defective parts for a line speed of 25 feet per minute (to 4 decimals). Use Table 1 of Appendix B. 29.895 to 29.895

Glencoe Algebra 1, Student Edition, 9780079039897, 0079039898, 2018
18th Edition
ISBN:9780079039897
Author:Carter
Publisher:Carter
Chapter4: Equations Of Linear Functions
Section4.6: Regression And Median-fit Lines
Problem 4GP

Related questions
Question
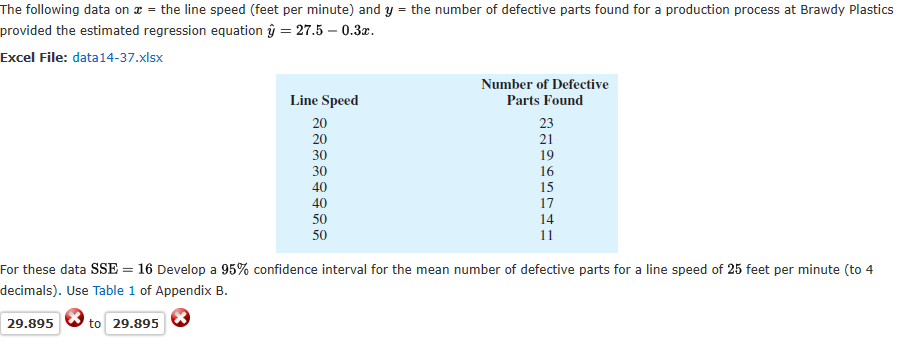
Transcribed Image Text:The following data on r = the line speed (feet per minute) and y = the number of defective parts found for a production process at Brawdy Plastics
provided the estimated regression equation ŷ = 27.5 – 0.3x.
Excel File: data14-37.xlsx
Number of Defective
Line Speed
Parts Found
20
23
20
21
30
19
30
16
40
15
40
17
50
14
50
11
For these data SSE = 16 Develop a 95% confidence interval for the mean number of defective parts for a line speed of 25 feet per minute (to 4
decimals). Use Table 1 of Appendix B.
29.895
to 29.895
Expert Solution
This question has been solved!
Explore an expertly crafted, step-by-step solution for a thorough understanding of key concepts.

This is a popular solution!

Trending now
This is a popular solution!

Step by step
Solved in 4 steps with 3 images

Recommended textbooks for you
Glencoe Algebra 1, Student Edition, 9780079039897…
Algebra
ISBN:
9780079039897
Author:
Carter
Publisher:
McGraw Hill

Functions and Change: A Modeling Approach to Coll…
Algebra
ISBN:
9781337111348
Author:
Bruce Crauder, Benny Evans, Alan Noell
Publisher:
Cengage Learning
Glencoe Algebra 1, Student Edition, 9780079039897…
Algebra
ISBN:
9780079039897
Author:
Carter
Publisher:
McGraw Hill
Functions and Change: A Modeling Approach to Coll…
Algebra
ISBN:
9781337111348
Author:
Bruce Crauder, Benny Evans, Alan Noell
Publisher:
Cengage Learning