Emma's On-the-Go, a large convenience store, has to decide where in the store to put its candy bar display rack. The manager at Emma's experiments with a selection of different locations, choosing a sample of days at each location. Each day, the manager records the amount of money brought in from the sale of candy bars. It's possible to test whether there is a difference in the mean daily sales for the different locations by doing a one-way, independent-samples ANOVA test. The variable of interest is the daily sales, in dollars, from candy bars at Emma's. In the ANOVA test, the "groups" are the different locations, and the "samples" are the daily candy bar sales actually examined by the manager. 122 (a) The following ANOVA table gives a summary of such an ANOVA test. Fill in the missing cell in the table (rounded to two decimal places). Degrees of freedom Sum of squares Mean square F statistic X $ ? 3 2346.59 782.2 0 Source of variation. Treatments (between groups) Error (within groups) 184 111,780 607.5 Total 187 114,126.59 (b) How many locations were looked at by the manager? 0 X 5 ? (c) For the ANOVA test, it is assumed that the variance is the same for each population of daily sales (that is, for the populations of daily sales for each location). What is an unbiased estimate of this common population variance based on the sample variances? 0 X S ? (d) What is the p-value corresponding to the F statistic for the ANOVA test? Round your answer to at least three decimal places. 0 X 5 ? (e) Can we conclude, using the 0.01 level of significance, that there is a difference in the mean daily sales among the different locations? Yes No X ? S Explanation. Check FB 90 A V 2022 McGraw Hill LLC. All Rights Reserved. Terms of Use | Privacy Center | Accessibility
Emma's On-the-Go, a large convenience store, has to decide where in the store to put its candy bar display rack. The manager at Emma's experiments with a selection of different locations, choosing a sample of days at each location. Each day, the manager records the amount of money brought in from the sale of candy bars. It's possible to test whether there is a difference in the mean daily sales for the different locations by doing a one-way, independent-samples ANOVA test. The variable of interest is the daily sales, in dollars, from candy bars at Emma's. In the ANOVA test, the "groups" are the different locations, and the "samples" are the daily candy bar sales actually examined by the manager. 122 (a) The following ANOVA table gives a summary of such an ANOVA test. Fill in the missing cell in the table (rounded to two decimal places). Degrees of freedom Sum of squares Mean square F statistic X $ ? 3 2346.59 782.2 0 Source of variation. Treatments (between groups) Error (within groups) 184 111,780 607.5 Total 187 114,126.59 (b) How many locations were looked at by the manager? 0 X 5 ? (c) For the ANOVA test, it is assumed that the variance is the same for each population of daily sales (that is, for the populations of daily sales for each location). What is an unbiased estimate of this common population variance based on the sample variances? 0 X S ? (d) What is the p-value corresponding to the F statistic for the ANOVA test? Round your answer to at least three decimal places. 0 X 5 ? (e) Can we conclude, using the 0.01 level of significance, that there is a difference in the mean daily sales among the different locations? Yes No X ? S Explanation. Check FB 90 A V 2022 McGraw Hill LLC. All Rights Reserved. Terms of Use | Privacy Center | Accessibility

Glencoe Algebra 1, Student Edition, 9780079039897, 0079039898, 2018
18th Edition
ISBN:9780079039897
Author:Carter
Publisher:Carter
Chapter10: Statistics
Section10.4: Distributions Of Data
Problem 19PFA

Related questions
Question
Please show how it's done
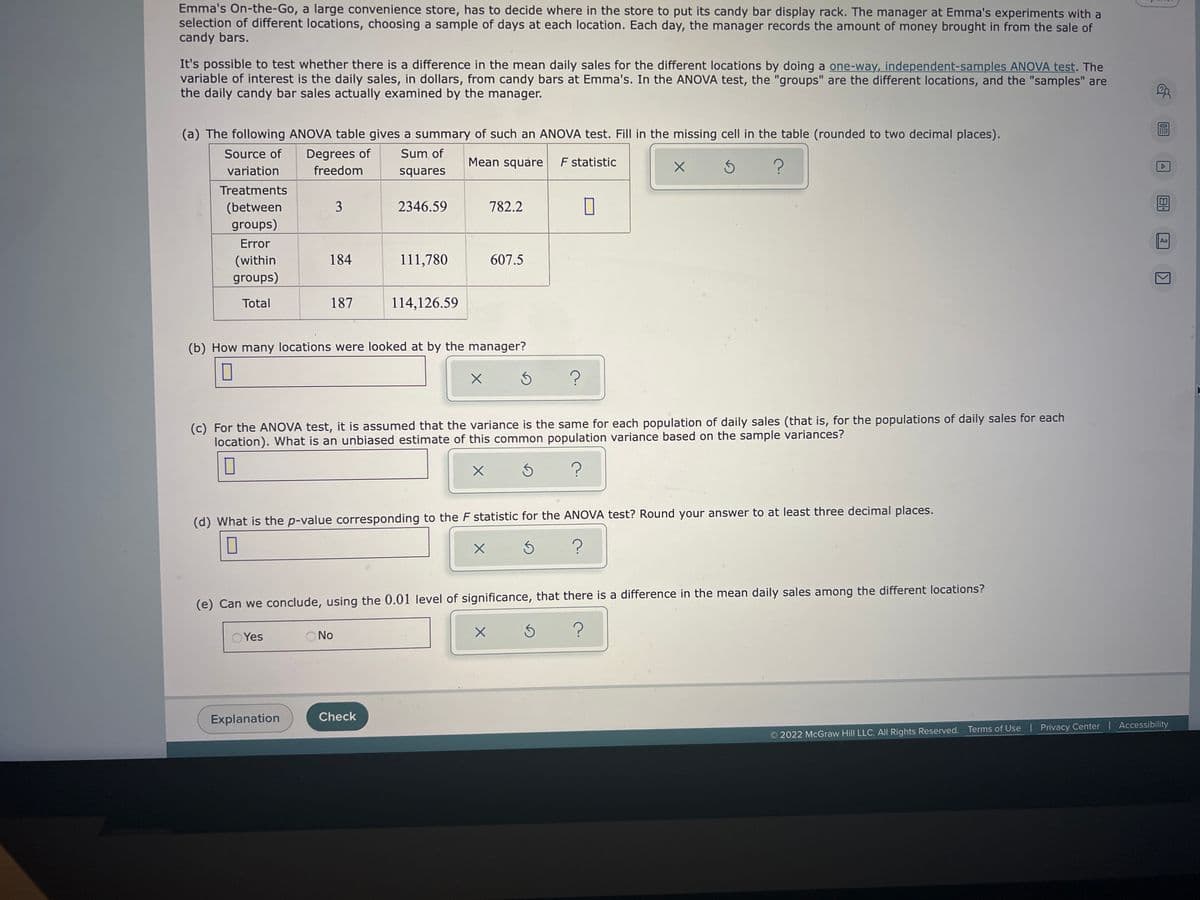
Transcribed Image Text:Emma's On-the-Go, a large convenience store, has to decide where in the store to put its candy bar display rack. The manager at Emma's experiments with a
selection of different locations, choosing a sample of days at each location. Each day, the manager records the amount of money brought in from the sale of
candy bars.
It's possible to test whether there is a difference in the mean daily sales for the different locations by doing a one-way, independent-samples ANOVA test. The
variable of interest is the daily sales, in dollars, from candy bars at Emma's. In the ANOVA test, the "groups" are the different locations, and the "samples" are
the daily candy bar sales actually examined by the manager.
(a) The following ANOVA table gives a summary of such an ANOVA test. Fill in the missing cell in the table (rounded to two decimal places).
Degrees of
freedom
Sum of
squares
Mean square F statistic
Ś
?
3
2346.59
782.2
Source of
variation
Treatments
(between
groups)
Error
(within
groups)
184
111,780
607.5
Total
187
114,126.59
(b) How many locations were looked at by the manager?
X
S
?
(c) For the ANOVA test, it is assumed that the variance is the same for each population of daily sales (that is, for the populations of daily sales for each
location). What is an unbiased estimate of this common population variance based on the sample variances?
X
5
?
(d) What is the p-value corresponding to the F statistic for the ANOVA test? Round your answer to at least three decimal places.
0
X
S
?
(e) Can we conclude, using the 0.01 level of significance, that there is a difference in the mean daily sales among the different locations?
Yes
No
X
S
?
Explanation
Check
X
OFFE
D
Aa
2022 McGraw Hill LLC. All Rights Reserved. Terms of Use | Privacy Center | Accessibility
Expert Solution
This question has been solved!
Explore an expertly crafted, step-by-step solution for a thorough understanding of key concepts.

This is a popular solution!

Trending now
This is a popular solution!

Step by step
Solved in 3 steps with 2 images

Recommended textbooks for you
Glencoe Algebra 1, Student Edition, 9780079039897…
Algebra
ISBN:
9780079039897
Author:
Carter
Publisher:
McGraw Hill

College Algebra (MindTap Course List)
Algebra
ISBN:
9781305652231
Author:
R. David Gustafson, Jeff Hughes
Publisher:
Cengage Learning
Glencoe Algebra 1, Student Edition, 9780079039897…
Algebra
ISBN:
9780079039897
Author:
Carter
Publisher:
McGraw Hill
College Algebra (MindTap Course List)
Algebra
ISBN:
9781305652231
Author:
R. David Gustafson, Jeff Hughes
Publisher:
Cengage Learning