en data represents a frequency distribution of the F-scale intensities of recent tornadoes. Use the cy distribution Frequency 26 7IT Tornado F-Scale o construct a frequency polygon. Does the graph suggest that the distribution is skewed? If 19 4. struct a frequency polygon using the data. Choose the correct graph below. OC. OD. OB. A. Frequency 30 Frequency 30 Frequency Frequency 30- FScale F-Scale F-Scale F-Scale Does the graph suggest that the distribution is skewed? If so, how? O A. The distribution appears to be skewed to both sides O B. The distribution appears to be skewed to the right (or positively skewed).
en data represents a frequency distribution of the F-scale intensities of recent tornadoes. Use the cy distribution Frequency 26 7IT Tornado F-Scale o construct a frequency polygon. Does the graph suggest that the distribution is skewed? If 19 4. struct a frequency polygon using the data. Choose the correct graph below. OC. OD. OB. A. Frequency 30 Frequency 30 Frequency Frequency 30- FScale F-Scale F-Scale F-Scale Does the graph suggest that the distribution is skewed? If so, how? O A. The distribution appears to be skewed to both sides O B. The distribution appears to be skewed to the right (or positively skewed).

Glencoe Algebra 1, Student Edition, 9780079039897, 0079039898, 2018
18th Edition
ISBN:9780079039897
Author:Carter
Publisher:Carter
Chapter10: Statistics
Section: Chapter Questions
Problem 27SGR

Related questions
Question
Transcribed Image Text:TIT
Frequency
26
19
2.
Tornado F-Scale
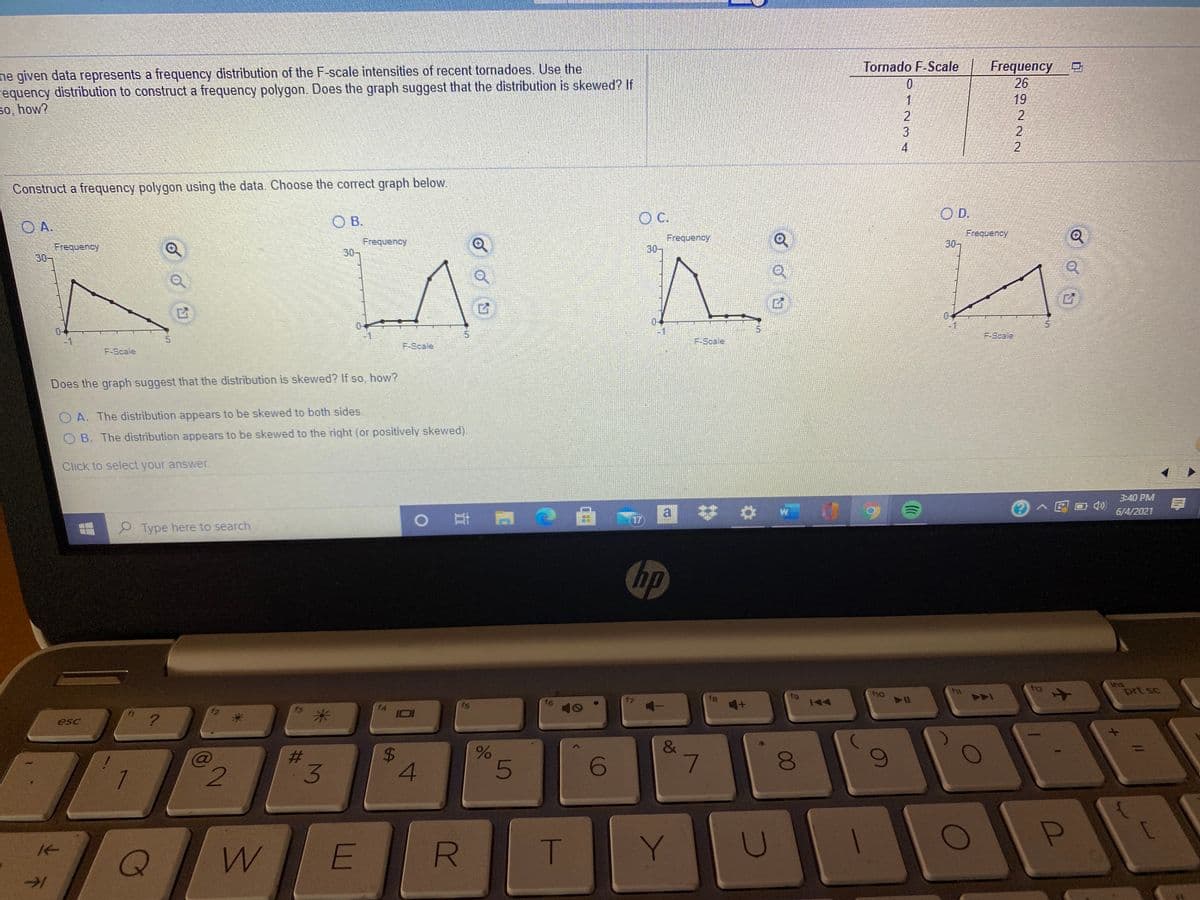
he given data represents a frequency distribution of the F-scale intensities of recent tornadoes, Use the
equency distribution to construct a frequency polygon. Does the graph suggest that the distribution is skewed? If
5o, how?
Construct a frequency polygon using the data. Choose the correct graph below.
OB.
C.
OD.
O A.
Frequency
30-
Frequency
30
Frequency
30-
Frequency
30-
0
-1
F-Scale
-1
F-Scale
F-Scale
F-Scale
Does the graph suggest that the distribution is skewed? If so, how?
O A. The distribution appears to be skewed to both sides.
O B. The distribution appears to be skewed to the right (or positively skewed).
Click to select your answer.
3:40 PM
a
4)
6/4/2021
耳
17
Type here to search
hp
ins
f12
f1o
prt sc
f6
40
fg
fg
144
AAA
米
I01
esc
&
$4
4
%23
3
5
7.
7
Y
00
R
%24
Expert Solution
This question has been solved!
Explore an expertly crafted, step-by-step solution for a thorough understanding of key concepts.

This is a popular solution!

Trending now
This is a popular solution!

Step by step
Solved in 2 steps with 1 images

Knowledge Booster


Learn more about
Need a deep-dive on the concept behind this application? Look no further. Learn more about this topic, statistics and related others by exploring similar questions and additional content below.Recommended textbooks for you
Glencoe Algebra 1, Student Edition, 9780079039897…
Algebra
ISBN:
9780079039897
Author:
Carter
Publisher:
McGraw Hill
Glencoe Algebra 1, Student Edition, 9780079039897…
Algebra
ISBN:
9780079039897
Author:
Carter
Publisher:
McGraw Hill