Evaluate the forecasts that would have been made over the 13 weeks using the overall (at the end of the 13 weeks) mean absolut eviation, mean absolute percent error, and tracking signal as criteria. (Negative values should be indicated by a minus sign. Rour | answers to 2 decimal places. Enter "MAPE" answers as a percentage rounded to 2 decimal places.)
Evaluate the forecasts that would have been made over the 13 weeks using the overall (at the end of the 13 weeks) mean absolut eviation, mean absolute percent error, and tracking signal as criteria. (Negative values should be indicated by a minus sign. Rour | answers to 2 decimal places. Enter "MAPE" answers as a percentage rounded to 2 decimal places.)

Chapter15: Retailing, Direct Marketing, And Wholesaling
Section15.1: L.l.bean: Open 24/7, Click Or Brick
Problem 3VC

Related questions
Question
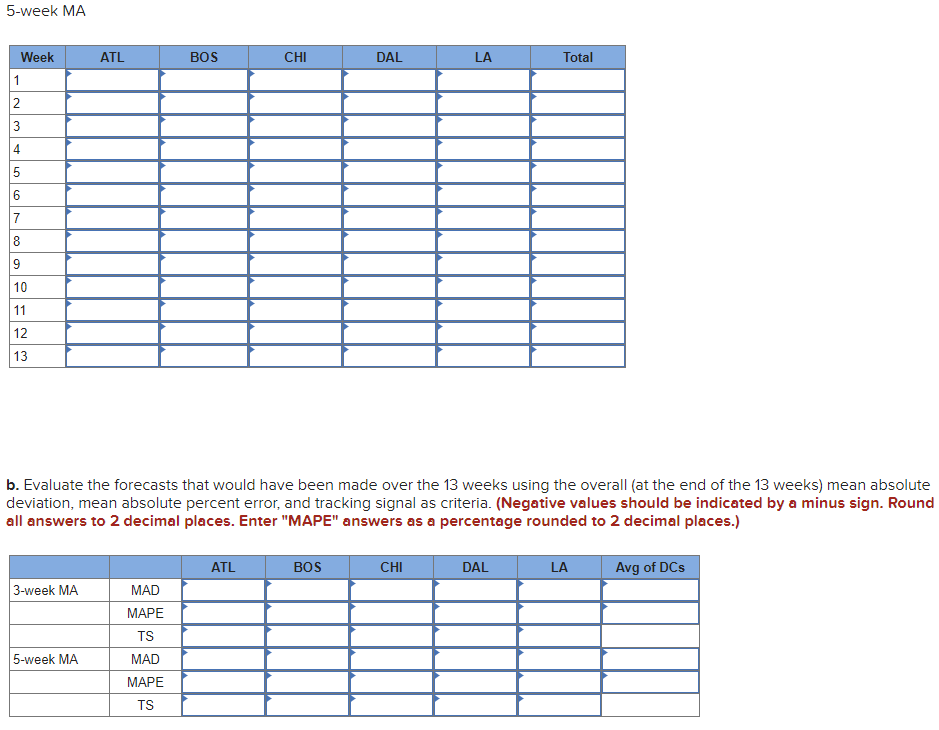
Transcribed Image Text:5-week MA
Week
ATL
BOS
CHI
DAL
LA
Total
1
2
4
6.
7
8
9
10
11
12
13
b. Evaluate the forecasts that would have been made over the 13 weeks using the overall (at the end of the 13 weeks) mean absolute
deviation, mean absolute percent error, and tracking signal as criteria. (Negative values should be indicated by a minus sign. Round
all answers to 2 decimal places. Enter "MAPE" answers as a percentage rounded to 2 decimal places.)
ATL
BOS
CHI
DAL
LA
Avg of DCs
3-week MA
MAD
МАРЕ
TS
5-week MA
MAD
МАРЕ
TS
3.
LC
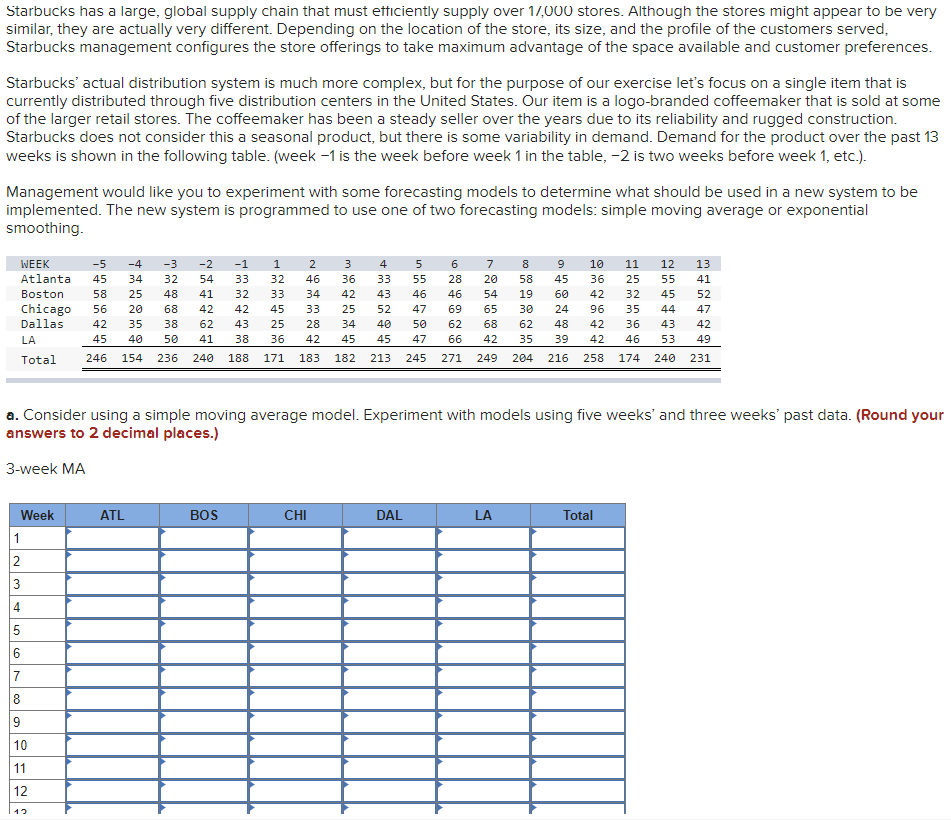
Transcribed Image Text:Starbucks has a large, global supply chain that must etticiently supply over 17,000 stores. Although the stores might appear to be very
similar, they are actually very different. Depending on the location of the store, its size, and the profile of the customers served,
Starbucks management configures the store offerings to take maximum advantage of the space available and customer preferences.
Starbucks' actual distribution system is much more complex, but for the purpose of our exercise let's focus on a single item that is
currently distributed through five distribution centers in the United States. Our item is a logo-branded coffeemaker that is sold at some
of the larger retail stores. The coffeemaker has been a steady seller over the years due to its reliability and rugged construction.
Starbucks does not consider this a seasonal product, but there is some variability in demand. Demand for the product over the past 13
weeks is shown in the following table. (week -1 is the week before week 1 in the table, -2 is two weeks before week 1, etc.).
Management would like you to experiment with some forecasting models to determine what should be used in a new system to be
implemented. The new system is programmed to use one of two forecasting models: simple moving average or exponential
smoothing.
WEEK
-5
-4
-3
-2
-1
2
3
4
6.
7
10
11
12
13
Atlanta
45
34
32
54
33
32
46
36
33
55
28
20
58
45
36
25
55
41
Boston
58
25
48
41
32
33
34
42
43
46
46
54
19
60
42
32
45
52
Chicago
Dallas
56
20
68
42
42
45
33
25
52
47
69
65
30
24
96
35
44
47
42
35
38
62
43
25
28
34
40
50
62
68
62
48
42
36
43
42
LA
45
40
50
41
38
36
42
45
45
47
66
42
35
39
42
46
53
49
Total
246
154
236
240
188
171
183
182
213
245
271
249
204
216
258
174
240
231
a. Consider using a simple moving average model. Experiment with models using five weeks' and three weeks' past data. (Round your
answers to 2 decimal places.)
3-week MA
Week
ATL
BOS
CHI
DAL
LA
Total
1
4
5
7
8
9
10
11
12
2.
3.
Expert Solution
This question has been solved!
Explore an expertly crafted, step-by-step solution for a thorough understanding of key concepts.

This is a popular solution!

Trending now
This is a popular solution!

Step by step
Solved in 3 steps with 3 images

Recommended textbooks for you