d. Follow part (b) above but using an alpha of 0.8 this time. Discuss the forecasting errors produced by using the two different exponential smoothing constants.
d. Follow part (b) above but using an alpha of 0.8 this time. Discuss the forecasting errors produced by using the two different exponential smoothing constants.

Practical Management Science
6th Edition
ISBN:9781337406659
Author:WINSTON, Wayne L.
Publisher:WINSTON, Wayne L.
Chapter13: Regression And Forecasting Models
Section: Chapter Questions
Problem 34P: A small computer chip manufacturer wants to forecast monthly ozperating costs as a function of the...

Related questions

Question
answer part d only
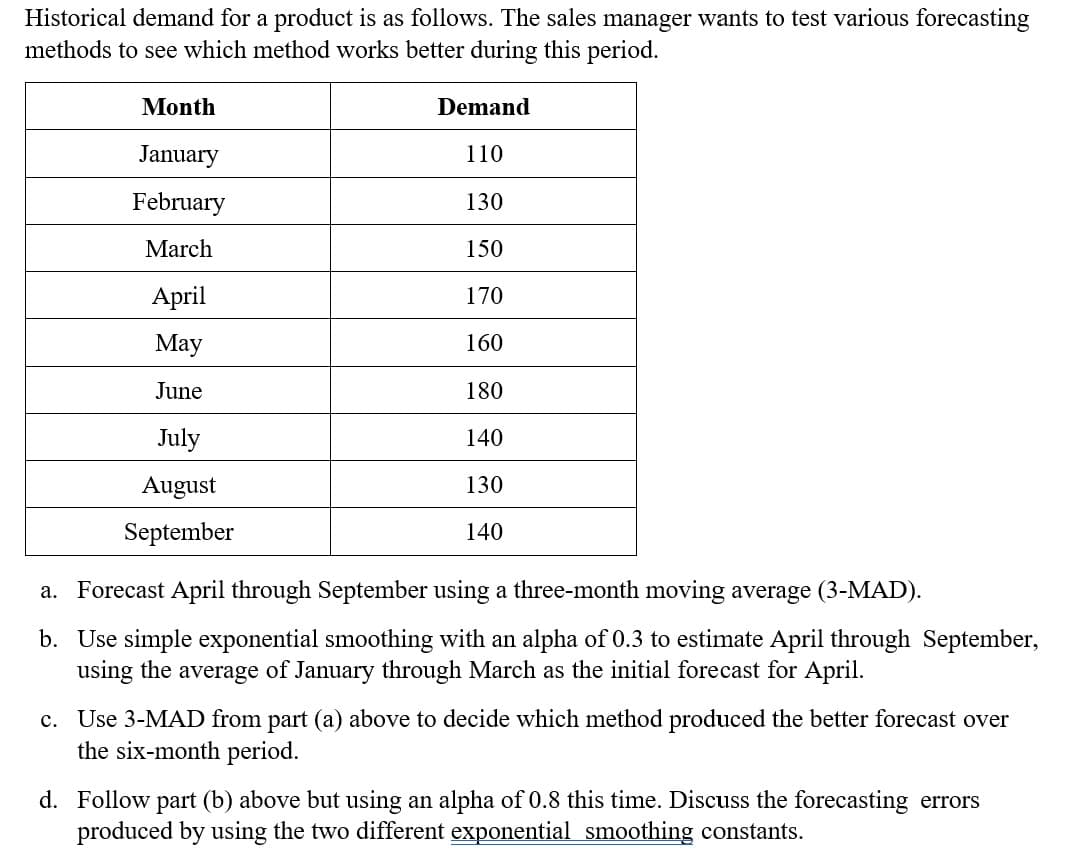
Transcribed Image Text:Historical demand for a product is as follows. The sales manager wants to test various forecasting
methods to see which method works better during this period.
Month
Demand
January
110
February
130
March
150
April
170
May
160
June
180
July
140
August
130
September
140
a. Forecast April through September using a three-month moving average (3-MAD).
b. Use simple exponential smoothing with an alpha of 0.3 to estimate April through September,
using the average of January through March as the initial forecast for April.
c. Use 3-MAD from part (a) above to decide which method produced the better forecast over
the six-month period.
d. Follow part (b) above but using an alpha of 0.8 this time. Discuss the forecasting errors
produced by using the two different exponential smoothing constants.
Expert Solution
This question has been solved!
Explore an expertly crafted, step-by-step solution for a thorough understanding of key concepts.

Step by step
Solved in 2 steps with 5 images

Knowledge Booster


Learn more about
Need a deep-dive on the concept behind this application? Look no further. Learn more about this topic, operations-management and related others by exploring similar questions and additional content below.Recommended textbooks for you
Practical Management Science
Operations Management
ISBN:
9781337406659
Author:
WINSTON, Wayne L.
Publisher:
Cengage,


Contemporary Marketing
Marketing
ISBN:
9780357033777
Author:
Louis E. Boone, David L. Kurtz
Publisher:
Cengage Learning
Practical Management Science
Operations Management
ISBN:
9781337406659
Author:
WINSTON, Wayne L.
Publisher:
Cengage,
Contemporary Marketing
Marketing
ISBN:
9780357033777
Author:
Louis E. Boone, David L. Kurtz
Publisher:
Cengage Learning
Marketing
Marketing
ISBN:
9780357033791
Author:
Pride, William M
Publisher:
South Western Educational Publishing