Examine the following sashimi plot from a transcriptomics experiment. The red peaks mostly RNA STAR on data 22; data 16; ar 34 2 1 545326 550237 555148 560059 O a. correspond to exons and represent respective coverage of exons O b. correspond to introns and represent respective coverage of introns
Examine the following sashimi plot from a transcriptomics experiment. The red peaks mostly RNA STAR on data 22; data 16; ar 34 2 1 545326 550237 555148 560059 O a. correspond to exons and represent respective coverage of exons O b. correspond to introns and represent respective coverage of introns

Biology: The Dynamic Science (MindTap Course List)
4th Edition
ISBN:9781305389892
Author:Peter J. Russell, Paul E. Hertz, Beverly McMillan
Publisher:Peter J. Russell, Paul E. Hertz, Beverly McMillan
Chapter19: Genomes And Proteomes
Section: Chapter Questions
Problem 1ITD: Below is a sequence of 540 bases from a genome. What information would you use to find the...

Related questions

Question
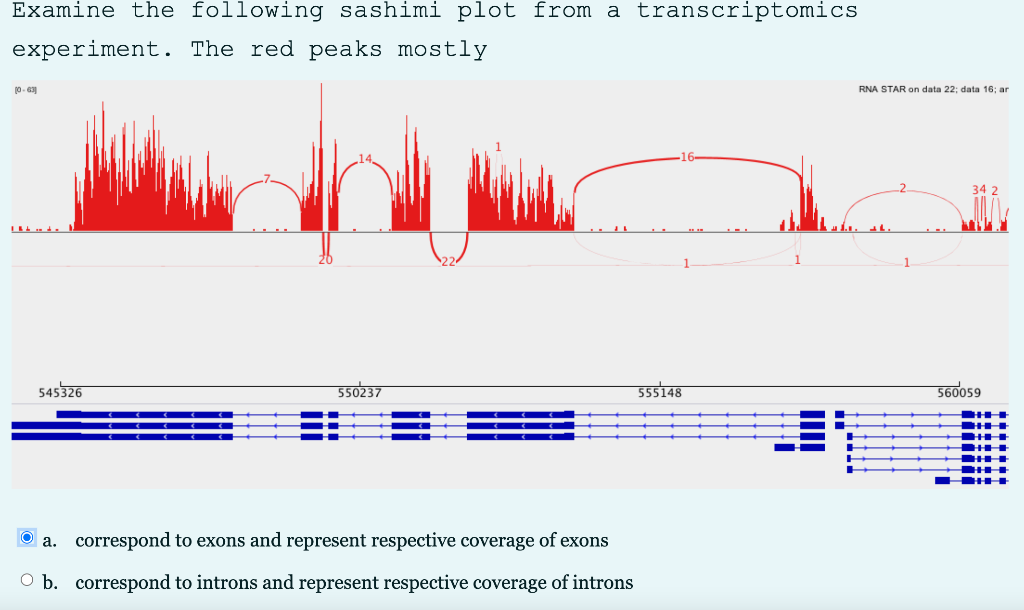
Transcribed Image Text:Examine the following sashimi plot from a transcriptomics
experiment. The red peaks mostly
RNA STAR on data 22; data 16; ar
34 2
1
545326
550237
555148
560059
O a. correspond to exons and represent respective coverage of exons
O b. correspond to introns and represent respective coverage of introns
Expert Solution
This question has been solved!
Explore an expertly crafted, step-by-step solution for a thorough understanding of key concepts.

This is a popular solution!

Trending now
This is a popular solution!

Step by step
Solved in 2 steps

Knowledge Booster


Learn more about
Need a deep-dive on the concept behind this application? Look no further. Learn more about this topic, biology and related others by exploring similar questions and additional content below.Recommended textbooks for you
Biology: The Dynamic Science (MindTap Course List)
Biology
ISBN:
9781305389892
Author:
Peter J. Russell, Paul E. Hertz, Beverly McMillan
Publisher:
Cengage Learning
Biology: The Dynamic Science (MindTap Course List)
Biology
ISBN:
9781305389892
Author:
Peter J. Russell, Paul E. Hertz, Beverly McMillan
Publisher:
Cengage Learning