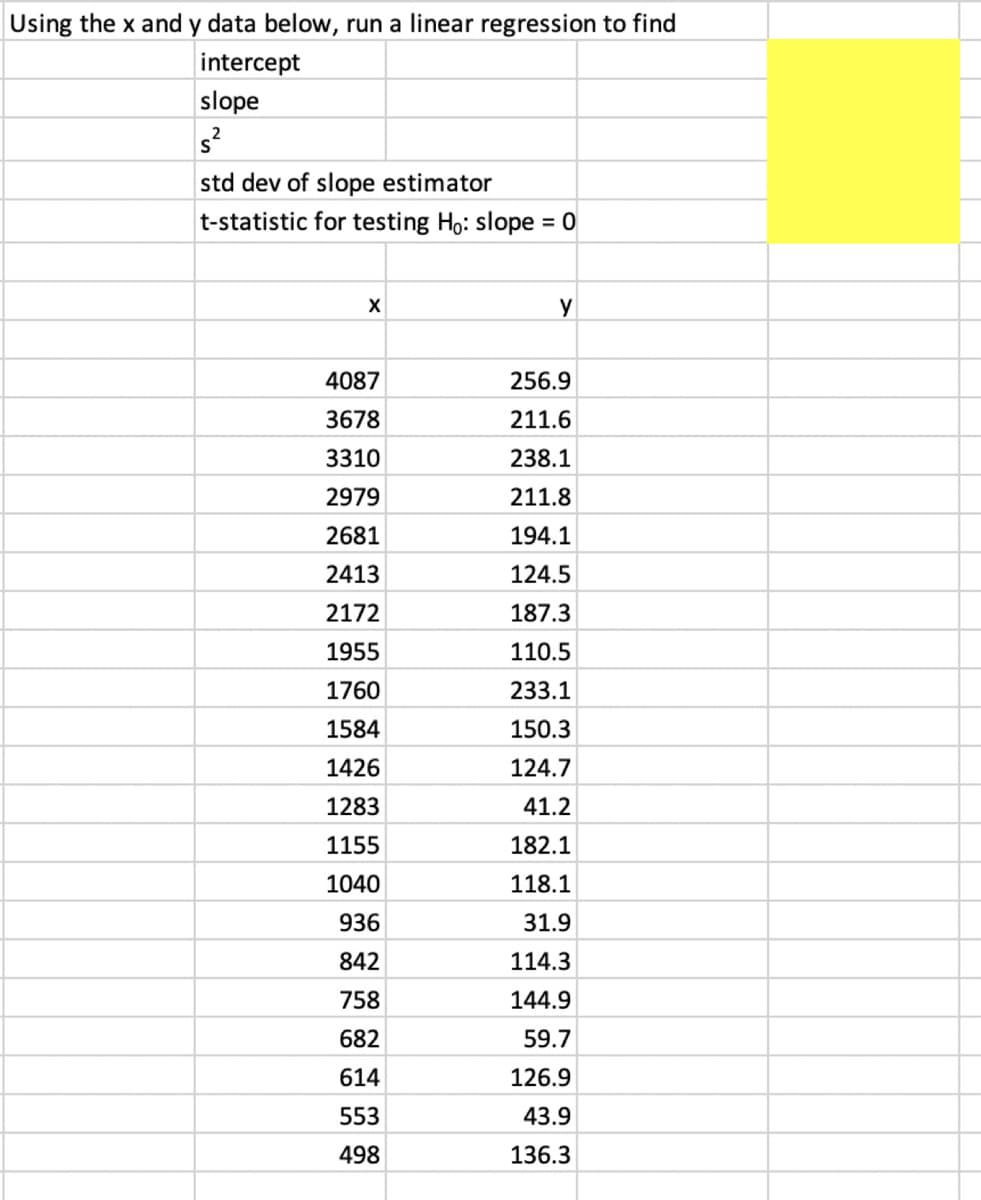
Using the x and y data below, run a linear regression to find intercept slope s? std dev of slope estimator t-statistic for testing Ho: slope = 0 4087 256.9 3678 211.6 3310 238.1 2979 211.8 2681 194.1 2413 124.5 2172 187.3 1955 110.5 1760 233.1 1584 150.3 1426 124.7 1283 41.2 1155 182.1 1040 118.1 936 31.9 842 114.3 758 144.9 682 59.7 614 126.9 553 43.9 498 136.3


Q: Using the data below, determine the value of the slope B1 in the linear regression line ŷ = B, +…
A: Given:
Q: Given the regression output below, what is the linear equation? call: Im(formula - sales - spend,…
A: The given information is about the regression output.
Q: Based on the data shown below, calculate the regression line (each value to two decimal places) y% =…
A: The required regression equation of Y on X is, y=a+bxwhere,a=y-interceptb=slope of the…
Q: Run a linear regression analysis on the following data set with y as the response variable. Use at…
A:
Q: The U.S. Postal Service is attempting to reduce the number of complaints made by the public against…
A: Given: r = 0.854 r squared = 0.730 Model Unstandardized Coefficients Standardized Coefficients t…
Q: A rich sports car owner wants to develop a regression equation that determines mileage as a function…
A: It is asked to solve only c and d parts. The solutions are as follows: c) The new dataset after…
Q: The following regression output is for predicting the heart weight (in g) of cats from their body…
A: Given, R2=64.66%=0.6466 Coefficient of determination that is R square is the square of correlation…
Q: Based on the data shown below, calculate the regression line (each value to two decimal places) y…
A:
Q: Site images for background. Is there evidence that Bathrooms adds important information to a model…
A: Solution: Let y be the price, x1 be the square feet, x2 be the price/square feet and x3 be the…
Q: Using a calculator or statistical software, find the linear regression line for the data in the…
A: The regression is a linear relationship between one dependent variable (Y) and one or more than one…
Q: Find the regression equation showing the regression equation of capacity utilisation on production…
A: Let X be the capacity utilisation Y be the production
Q: The following regression output is for predicting the heart weight (in g) of cats from their body…
A: From the output, the slope is 4.034 and the intercept is -0.357.
Q: . Use linear regression to find the line that fits the data and determine the standard deviation.…
A: Given: Sum or total of each column :
Q: Based on the data shown below, calculate the regression line (each value to two decimal places) y =…
A: Given data x y 1 6.36 2 3.82 3 6.28 4 5.64 5 4.3 6 7.06
Q: In your new role as a data scientist for a logging company, you build a regression for the value of…
A: The coefficient on the diameter is given by 36.80 inches.
Q: Use multiple linear regression to fit the following tabulated data: x1 4.5 6. 75 6. 12 x2 8.5 11…
A: For the given data Find Multiple regression equation is =? Standard error of estimate =? Correlation…
Q: Do the Complete REGRESSION ANALYSIS using the data given in table A ( Do the analysis using suitable…
A: Use the R-studio and perform the linear regression Programm :-…
Q: The U.S. Postal Service is attempting to reduce the number of complaints made by the public against…
A:
Q: Based on the data shown below, calculate the slope and y-intercept and determine the regression…
A:
Q: Run a regression analysis on the following bivariate set of data with y as the response variable. x…
A:
Q: Based on the data shown below, calculate the regression line (each value to at least two decimal…
A:
Q: A random sample of ten professional athletes produced the following data where x is the number of…
A: 1. Scatter plot gives the relationship between two quantitative variables . Scatter plot showing…
Q: The U.S. Postal Service is attempting to reduce the number of complaints made by the public against…
A: Given Information: The U.S. Postal Service is attempting to reduce the number of complaints made by…
Q: Run a regression analysis on the following data set, where y is the final grade in a math class and…
A: From the provided information, x y 4 47.6 5 53 5 59 5 53 7 50.8…
Q: Based on the data shown below, calculate the regression line (each value to at least two decimal…
A: X-Mx Y-My X-Mx2 X-MxY-My-2.5 2.2 6.25 -6.25-1.5 2.58…
Q: Estimate the age of husband when the age of wife is 19 ►Estimate the age of wife when the age of…
A: Given: age of husband age of wife 25 18 22 15 28 20 26 17 35 22 20 14 22 16 40 21…
Q: A Director of Human Resources is exploring employee absenteeism at the INCOVA Hospital. A multiple…
A: Regression Coefficient: The coefficient in the regression equation implies how much the mean of the…
Q: Examine the scatterplot for the data in the table below. 2 14 4 18 6 19 9 33 10 24 12 25 13 26 14 27…
A: Scatterplot is also known as the scatter gram, scatter graph or scatter charts. It uses dots to…
Q: Use the given data to find the equation of the regression line. Examine the scatterplot and identify…
A: The provided information is x y xy x2 10 7.46 74.6 100 9 6.83 61.47 81 11 13.11 144.21 121…
Q: Run a regression analysis on the following data set, where y is the final grade in a math class and…
A: Given observation and calculation is shown below Hours/Week(x) Grade(y) x2 y2 xy 5 56 25 3136…
Q: Based on the data shown below, calculate the regression line (each value to two decimal places) y%3D…
A:
Q: Examine the scatterplot for the data in the table below. y 2 4 3. 11 7 12 37 14 16 15 21 16 26 18 28…
A: Given: x y 2 4 3 5 11 7 12 37 14 16 15 21 16 26 18 28 19 32 20 34
Q: The following regression output is for predicting the heart weight (in g) of cats from their body…
A: a) Linear model is y=-0.357+4.034*body weight where intercept = -0.357 slope = 4.034 b) Interpreting…
Q: Run a regression analysis on the following data set, where yy is the final grade in a math class and…
A: It was stated to run regression analysis on the following data set. y is the final grade in a math…
Q: Run a regression analysis on the following data set, where y is the final grade in a math class and…
A: Regression: The regression analysis is conducted here by using EXCEL. The software procedure is…
Q: Run a regression analysis on the following data set, where yy is the final grade in a math class and…
A:
Q: Run a regression analysis on the following data set, where y is the final grade in a math class and…
A:
Q: Run a regression analysis on the following data set, where y is the final grade in a math class and…
A: From given data, X Y X*Y X*X 5 43 215 25 8 71.2 569.6 64 9 71.6 644.4 81 12 72.8 873.6…
Q: Run a regression analysis on the following data set, where y is the final grade in a math class and…
A:
Q: sed on the data shown below, use software such as Excel to calculate the slope and intercept and…
A:
Q: Run a regression analysis on the following data set, where y is the final grade in a math class and…
A: Given: The given data x (Hours/week) y (Grade) 5 62 8 63.2 9 67.6 12 76.8 13 86.2 14…
Q: Based on the data shown below, calculate the regression line (each value to two decimal places) Find…
A:
Q: Use the given data to find the equation of the regression line. Examine the scatterplot and identify…
A: Given information: x y X^2 Y^2 XY 14 19.64 196 385.7296 274.96 8 15.5 64 240.25 124 10…
Q: Below is the regression output from a model for predicting the heart weight (in g) of cats from…
A: a) The hypothesis for testing the given association are- H0: beta1=0 Vs Ha:β1!=0, where beta1 is…
Q: Based on the data shown below, calculate the regression line (each value to two decimal places) y =…
A: The following data has been given: x y 3 18.66 4 20.18 5 21.4 6 22.22 7 21.44 8 23.56…
Q: Run a regression analysis on the following data set, where y is the final grade in a math class and…
A: Solution 1) y =43.02+2.99*x
Q: How do find the answer on paper and the TI84
A: Computation of regression line equation:Step-by-step procedure to find the regression line equation…
Q: What is the slope of the regression line when predicting Y from X?X Y10 811 1011 88…
A:
Q: A group of students measure the length and width of a random sample of beans. They are interested in…
A: c) Here, the correlation coefficient is 0.8459.

Step by step
Solved in 2 steps with 2 images

- Given the table below, Let y, x1, x2, and x3 be the time of concentration (t, in hr), watershed length (L in ft), watershed slope (S in %), and runoff curve number (CN): Evaluate the linear multiple regression model with two or three predictor variables. Compute the multiple correlation coefficient, the standard error of estimate, and the standard deviation of the variable y. Discuss the reliability of the modelwhich of the following regressions represents the strongest negative linear relationship between x and y? (Attached in picture provided)A car dealership would like to develop a regression model that would predict the number of cars sold per month by a dealership employee based on theemployee's number of years of sales experience. The accompanying regression output was developed based on a random sample of employees. ANOVA df SS Regression 1 79.909407 Residual 23 261.210593 Total 24 341.12 Coefficients Standard Error Intercept 7.271539 1.229763 Slope 0.539854 0.203521 The coefficient of determination is 0.234 Test statistic= 0.704 P-value= 0.014 Construct a 95% confidence interval around the sample slope and interpret its meaning. The confidence interval is (__________,_________). (Type an integer or decimal rounded to three decimal places as needed.)
- A microcomputer manufacturer has developed a regression model relating his sales (y=$10,000s) with three independent variables. The three independent variables are price per unit(Price in $100s), advertising( ADV in $1000s) and the number of product lines (Lines). Part of the regression results is shown below. Coefficient Standard Error Intercept 1.0211 22.8752 Price(X1) -0.1524 0.1411 ADV (X2) 0.8849 0.2886 Lines(X3) -0.1463 1.5340 Source d.f. S.S. Regression 3 2708.61 Error 14 2840.51 Total 17 5549.12 What has been the sample size (n) for this analysis? Use the above results to find the estimated multiple…A car dealership would like to develop a regression model that would predict the number of cars sold per month by a dealership employee based on the employee's number of years of sales experience. The accompanying regression output was developed based on a random sample of employees. ANOVA df SS Regression 1 79.909407 Residual 23 261.210593 Total 24 341.12 Coefficients Standard Error Intercept 7.271539 1.229763 Slope 0.539854 Predict the sales next month for an employee with 2.5 years of experience. The predicted sales is _________ cars. (Type an integer or decimal rounded to one decimal place as needed.)Using the regression line attached. Based on only the above plot, one can conclude: a) height causes an increase in weight b) weight causes an increase in height c) taller people are more likely to weigh more than shorter people, at least in the sample on which this data is based d) a statistically significant predictive relationship between height and weight e) c and d
- In bivariate regression, the amount of change in Y for one-unit change in X is: Group of answer choices Coiefficient Residual Slope Nove of the aboveIn a sample of cars reviewed by Motor Trend magazine, the mean horsepower (hp) was 150 hp with a standard deviation of 36 hp. The mean weight (lbs) was 2500 lbs with a standard deviation of 720 lbs. Assume the relationship between weight and horsepower is linear and has a correlation of r = +0.55. What is the slope of the linear regression model predicting weight (y-variable) from horsepower (x-variable)? 9 13 15 11A study was done to compare tree height with trunk thickness. The following output was generated from the regression model.Simple linear regression results:Dependent Variable: Tree HeightIndependent Variable: Trunk SizeHeight = 39.041668 + 8.668677 TrunkSample size: 25R (correlation coefficient) = 0.4418R-sq = 0.1952Estimate of error standard deviation: 10.09977Parameter estimates: Parameter Estimate Std. Err. Intercept 39.041668 15.1736 Trunk 8.668677 3.670058 Assuming the conditions are met test if trunk size is a good predictor of tree height
- The following data is a regression model where the U.S. Department of Transportation has tried to relate the rate of fatal traffic accidents (per 1000 licenses) to the percentage of motorists under the age of 21. Data has been collected for 42 major cities in the United States. SUMMARY OUTPUT Regression Statistics Multiple R 0.83938748 R Square 0.70457134 Adjusted R Square 0.69718562 Standard Error 0.58935028 Observations 42 ANOVA df SS MS F Regression 1 33.13441764 33.1344 95.3964 Residual 40 13.89335048 0.34733 Total 41 47.02776812 Coefficients Standard Error t Stat P-value Intercept -1.5974138 0.371671454 -4.2979 0.00010 Percent Under 21 0.28705317 0.029389769 9.76711 3.79E-9…A car dealership would like to develop a regression model that would predict the number of cars sold per month by a dealership employee based on theemployee's number of years of sales experience. The accompanying regression output was developed based on a random sample of employees. ANOVA df SS Regression 1 79.909407 Residual 23 261.210593 Total 24 341.12 Coefficients Standard Error Intercept 7.271539 1.229763 Slope 0.539854 1. Predict the sales next month for an employee with 2.5 years of experience. The predicted sales is 8.6 cars. 2. Compute the coefficient of determination and interpret its meaning. The coefficient of determination is 0.234. 3. Do the sample data provide evidence that the model is useful for predicting average monthly sales for employees based on their sales experience using α=0.05? The test statistic is (Type an integer or decimal rounded to two decimal places as…In a sample of cars reviewed by Motor Trend magazine, the mean horsepower (hp) was 150 hp with a standard deviation of 36 hp. The mean weight (lbs) was 2500 lbs with a standard deviation of 720 lbs. Assume the relationship between weight and horsepower is linear and has a correlation of r = +0.55. What is the slope of the linear regression model predicting weight (y-variable) from horsepower (x-variable)? using the value of the slope you found, now compute the intercept of the linear regression model predicting weight (y-variable) from horsepower (x-variable). 850 550 1150 250