Example 2: Use least-squares regression to fit a straight line to x and y values given below. Along with the slope and intercept, compute the standard error of the estimate and the correlation coefficient. Plot the data and the regression line. 15 17 4. 11 12 19 9 8 7 6. 7 6 10 12 12 Σy 82 nExiy-ExEy a = nEx1²-Ex1)² n = 10 10(911)-(95)(82) = 0.3524699599 10(1277)-(95)z Ex;yi = 911 95 = 9.5 10 ao = ỹ – aqã = 8.2 – 0.3524699599(9.5) = 4.851535381 Ex;? = 1277 y =- = 8.2 10 Σχ 95 Therefore, the least square fit is: y = 4.851535381 + 0.3524699599x Least-Squares Fit of a Straight Line 14 Standard error of the estimate 12 Sr Evi-ao-a‚x¡)² Vn-2 n-2 10 Sy 9.073965287 %3D = 1.0650097 10-2 6 Correlation coefficient r2 = St-Sr - EGi-y)²-E(yi-ao-a,x;)² St 2 55.60-9.073965287 r2 = 55,60 10 15 20 r2 = 0.8367991855 r = 0.9147672849 a.) Repeat the problem Example 2, but regress x versus y variables. Interpret your results. Plot the data and the regression line. Interpret your results. that is, switch the 4. 6. 11 12 15 17 19 y 7 8 7 10 12 12
Example 2: Use least-squares regression to fit a straight line to x and y values given below. Along with the slope and intercept, compute the standard error of the estimate and the correlation coefficient. Plot the data and the regression line. 15 17 4. 11 12 19 9 8 7 6. 7 6 10 12 12 Σy 82 nExiy-ExEy a = nEx1²-Ex1)² n = 10 10(911)-(95)(82) = 0.3524699599 10(1277)-(95)z Ex;yi = 911 95 = 9.5 10 ao = ỹ – aqã = 8.2 – 0.3524699599(9.5) = 4.851535381 Ex;? = 1277 y =- = 8.2 10 Σχ 95 Therefore, the least square fit is: y = 4.851535381 + 0.3524699599x Least-Squares Fit of a Straight Line 14 Standard error of the estimate 12 Sr Evi-ao-a‚x¡)² Vn-2 n-2 10 Sy 9.073965287 %3D = 1.0650097 10-2 6 Correlation coefficient r2 = St-Sr - EGi-y)²-E(yi-ao-a,x;)² St 2 55.60-9.073965287 r2 = 55,60 10 15 20 r2 = 0.8367991855 r = 0.9147672849 a.) Repeat the problem Example 2, but regress x versus y variables. Interpret your results. Plot the data and the regression line. Interpret your results. that is, switch the 4. 6. 11 12 15 17 19 y 7 8 7 10 12 12

College Algebra
7th Edition
ISBN:9781305115545
Author:James Stewart, Lothar Redlin, Saleem Watson
Publisher:James Stewart, Lothar Redlin, Saleem Watson
Chapter1: Equations And Graphs
Section: Chapter Questions
Problem 10T: Olympic Pole Vault The graph in Figure 7 indicates that in recent years the winning Olympic men’s...

Related questions
Question
100%
Subject: NUMERICAL METHODS
Directions: In example no. 2, the problem and solution are both given. Please answer letter a.
Thank you in advance tutors!
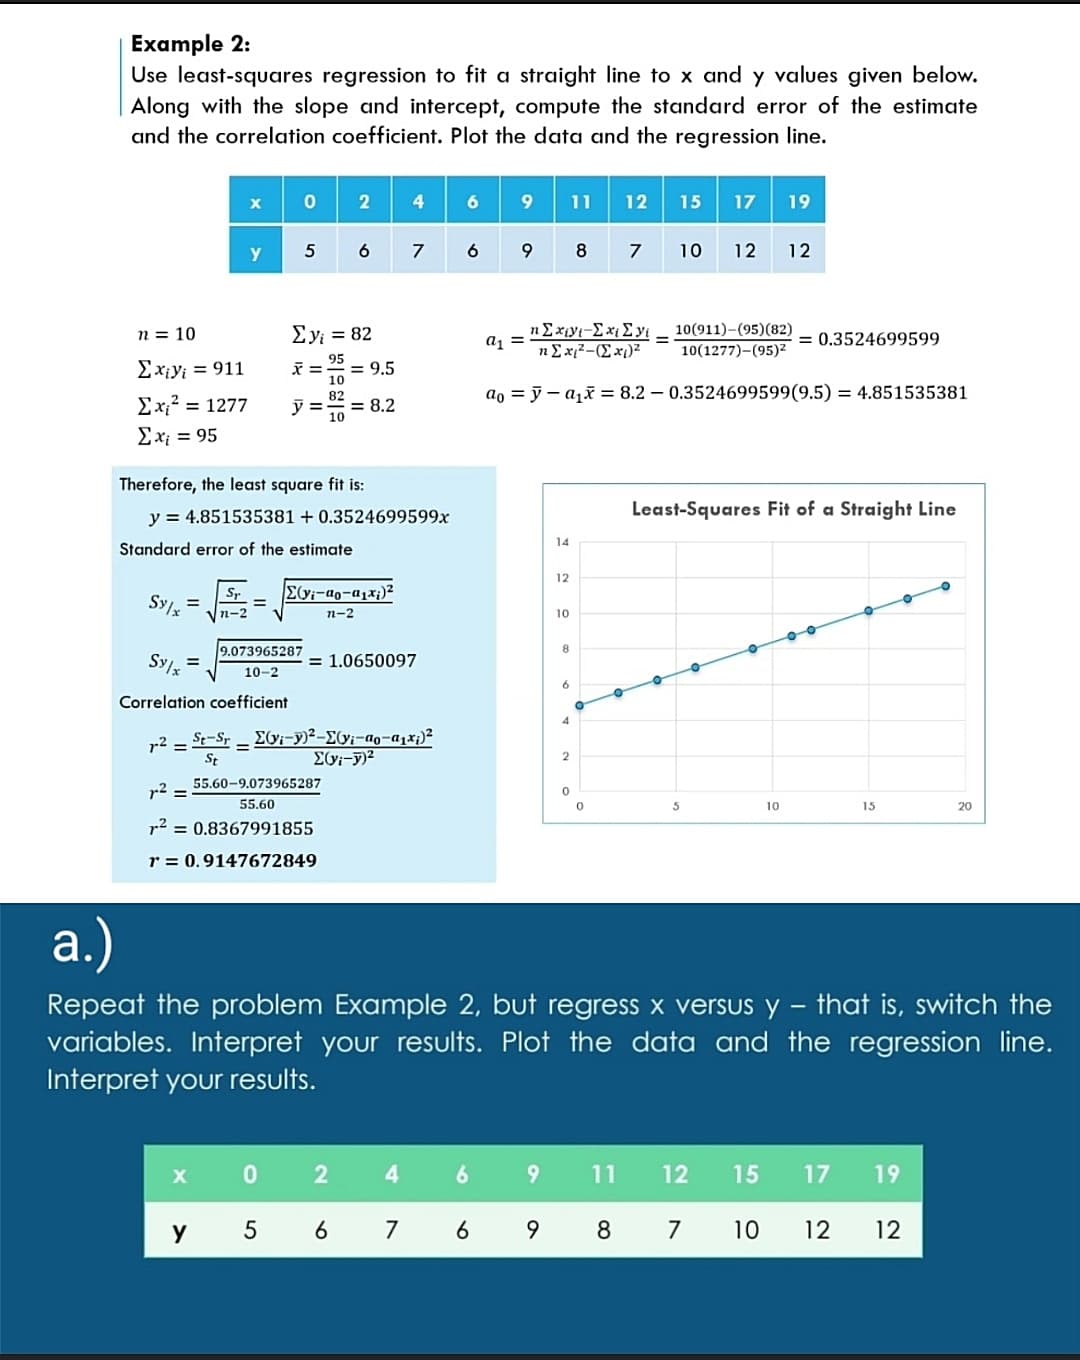
Transcribed Image Text:Example 2:
Use least-squares regression to fit a straight line to x and y values given below.
Along with the slope and intercept, compute the standard error of the estimate
and the correlation coefficient. Plot the data and the regression line.
4.
11
12
15
17
19
9 8 7
y
5
7
10
12
12
nEx¡yt-Ex; £ yi
η Σx2-Σ x)2
10(911)-(95)(82)
%3D
n = 10
Σy82
a, =
= 0.3524699599
10(1277)-(95)z
Ex¡yi = 911
95
= 9.5
10
ao = ỹ – ajã = 8.2 – 0.3524699599(9.5) = 4.851535381
Σχ 1277
=
= 8.2
ΣΧ 95
Therefore, the least square fit is:
y = 4.851535381 + 0.3524699599x
Least-Squares Fit of a Straight Line
14
Standard error of the estimate
12
Sr
Vn-2
Evi-ao-a;x;)²
%3D
п-2
10
9.073965287
8
Sy =
= 1.0650097
10-2
6
Correlation coefficient
4
EGi-y)²-E(y;-ao-a,x;)?
r2 = St-Sr -
St
55.60-9.073965287
r2 =
55.60
10
15
20
r2 = 0.8367991855
r = 0.9147672849
a.)
Repeat the problem Example 2, but regress x versus y - that is, switch the
variables. Interpret your results. Plot the data and the regression line.
Interpret your results.
4
9.
11
12
15
17
19
y
6
7
6
9
8 7
10
12
12
Expert Solution
This question has been solved!
Explore an expertly crafted, step-by-step solution for a thorough understanding of key concepts.

This is a popular solution!

Trending now
This is a popular solution!

Step by step
Solved in 3 steps with 4 images

Recommended textbooks for you
College Algebra
Algebra
ISBN:
9781305115545
Author:
James Stewart, Lothar Redlin, Saleem Watson
Publisher:
Cengage Learning

Glencoe Algebra 1, Student Edition, 9780079039897…
Algebra
ISBN:
9780079039897
Author:
Carter
Publisher:
McGraw Hill
College Algebra
Algebra
ISBN:
9781305115545
Author:
James Stewart, Lothar Redlin, Saleem Watson
Publisher:
Cengage Learning
Glencoe Algebra 1, Student Edition, 9780079039897…
Algebra
ISBN:
9780079039897
Author:
Carter
Publisher:
McGraw Hill