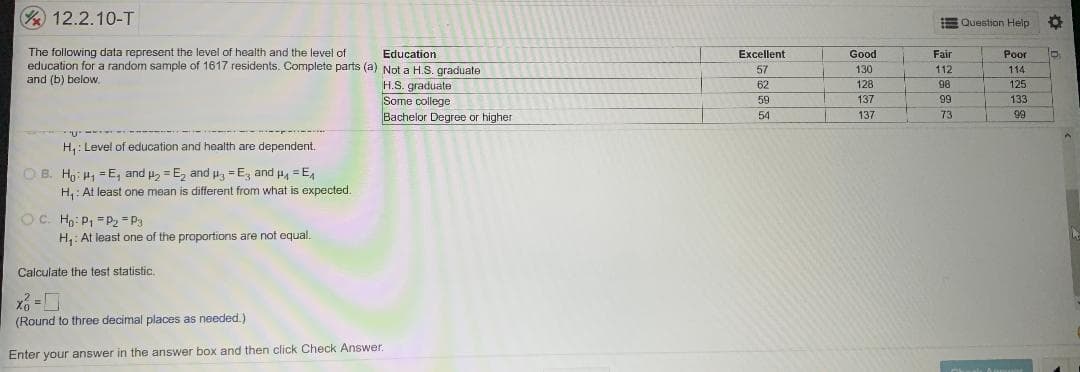
Excellent The following data represent the level of health and the level of education for a random sample of 1617 residents. Complete parts (a) Nnt a HS graduate and (b) below, Education Good Fair Poor 57 130 112 114 H.S. graduate Some college Bachelor Degree or higher 62 128 98 125 59 137 99 133 54 137 73 99 H,: Level of education and health are dependent. O B. H,: H, =E, and 2 =E, and p, =E, and p, = E, H,: At least one mean is different from what is expected. OC. Hg: P1 =P2 = P3 H,: At least one of the proportions are not equal. Calculate the test statistic. (Round to three decimal places as needed.) Enter your answer in the answer box and then click Check Answer.


Inverse Normal Distribution
The method used for finding the corresponding z-critical value in a normal distribution using the known probability is said to be an inverse normal distribution. The inverse normal distribution is a continuous probability distribution with a family of two parameters.
Mean, Median, Mode
It is a descriptive summary of a data set. It can be defined by using some of the measures. The central tendencies do not provide information regarding individual data from the dataset. However, they give a summary of the data set. The central tendency or measure of central tendency is a central or typical value for a probability distribution.
Z-Scores
A z-score is a unit of measurement used in statistics to describe the position of a raw score in terms of its distance from the mean, measured with reference to standard deviation from the mean. Z-scores are useful in statistics because they allow comparison between two scores that belong to different normal distributions.


Trending now
This is a popular solution!

Step by step
Solved in 3 steps with 5 images


