Exercise 1 Summarize the data below obtained from the protein experiments for determination of protein concentration in the form of a graph. Plot a graph containing a title and labels for both of the axis. Three readings were taken for each protein concentration. Find the averages and standard deviations for each reading and plot your graph using Microsoft EXCEL, complete with the error bars. This graph represents a calibration curve for a protein assay (next experiment) where this will be used to measure the protein concentration in an unknown protein solution. Concentration of protein Absorbance, 595 nm (µg/mL) 1 2 0.04 0.05 0.03 0.12 0.11 0.14 0.26 0.25 0.25 10 0.49 0.49 0.51 25 0.82 0.85 0.83 50 1.28 1.24 1.25
Exercise 1 Summarize the data below obtained from the protein experiments for determination of protein concentration in the form of a graph. Plot a graph containing a title and labels for both of the axis. Three readings were taken for each protein concentration. Find the averages and standard deviations for each reading and plot your graph using Microsoft EXCEL, complete with the error bars. This graph represents a calibration curve for a protein assay (next experiment) where this will be used to measure the protein concentration in an unknown protein solution. Concentration of protein Absorbance, 595 nm (µg/mL) 1 2 0.04 0.05 0.03 0.12 0.11 0.14 0.26 0.25 0.25 10 0.49 0.49 0.51 25 0.82 0.85 0.83 50 1.28 1.24 1.25

Biochemistry
9th Edition
ISBN:9781305961135
Author:Mary K. Campbell, Shawn O. Farrell, Owen M. McDougal
Publisher:Mary K. Campbell, Shawn O. Farrell, Owen M. McDougal
Chapter15: The Importance Of Energy Changes And Electron Transfer In Metabolism
Section: Chapter Questions
Problem 12RE: MATHEMATICAL Consider the reaction AB+C, where G=0.00. (a) What is the value of G (not G) when the...

Related questions
Question
Reminder : ONLY ONE GRAPH
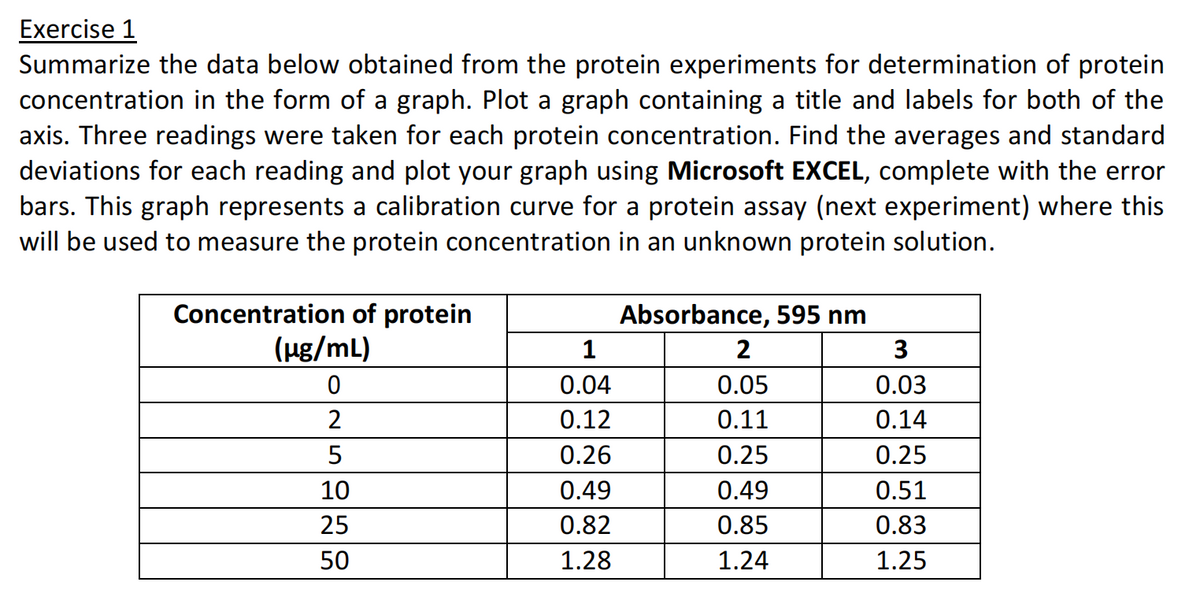
Transcribed Image Text:Exercise 1
Summarize the data below obtained from the protein experiments for determination of protein
concentration in the form of a graph. Plot a graph containing a title and labels for both of the
axis. Three readings were taken for each protein concentration. Find the averages and standard
deviations for each reading and plot your graph using Microsoft EXCEL, complete with the error
bars. This graph represents
will be used to measure the protein concentration in an unknown protein solution.
calibration curve for a protein assay (next experiment) where this
Concentration of protein
(Hg/mL)
Absorbance, 595 nm
1
2
3
0.04
0.05
0.03
2
0.12
0.11
0.14
5
0.26
0.25
0.25
10
0.49
0.49
0.51
25
0.82
0.85
0.83
50
1.28
1.24
1.25
Expert Solution
This question has been solved!
Explore an expertly crafted, step-by-step solution for a thorough understanding of key concepts.

Step by step
Solved in 2 steps with 4 images

Recommended textbooks for you
Biochemistry
Biochemistry
ISBN:
9781305961135
Author:
Mary K. Campbell, Shawn O. Farrell, Owen M. McDougal
Publisher:
Cengage Learning
Biochemistry
Biochemistry
ISBN:
9781305961135
Author:
Mary K. Campbell, Shawn O. Farrell, Owen M. McDougal
Publisher:
Cengage Learning