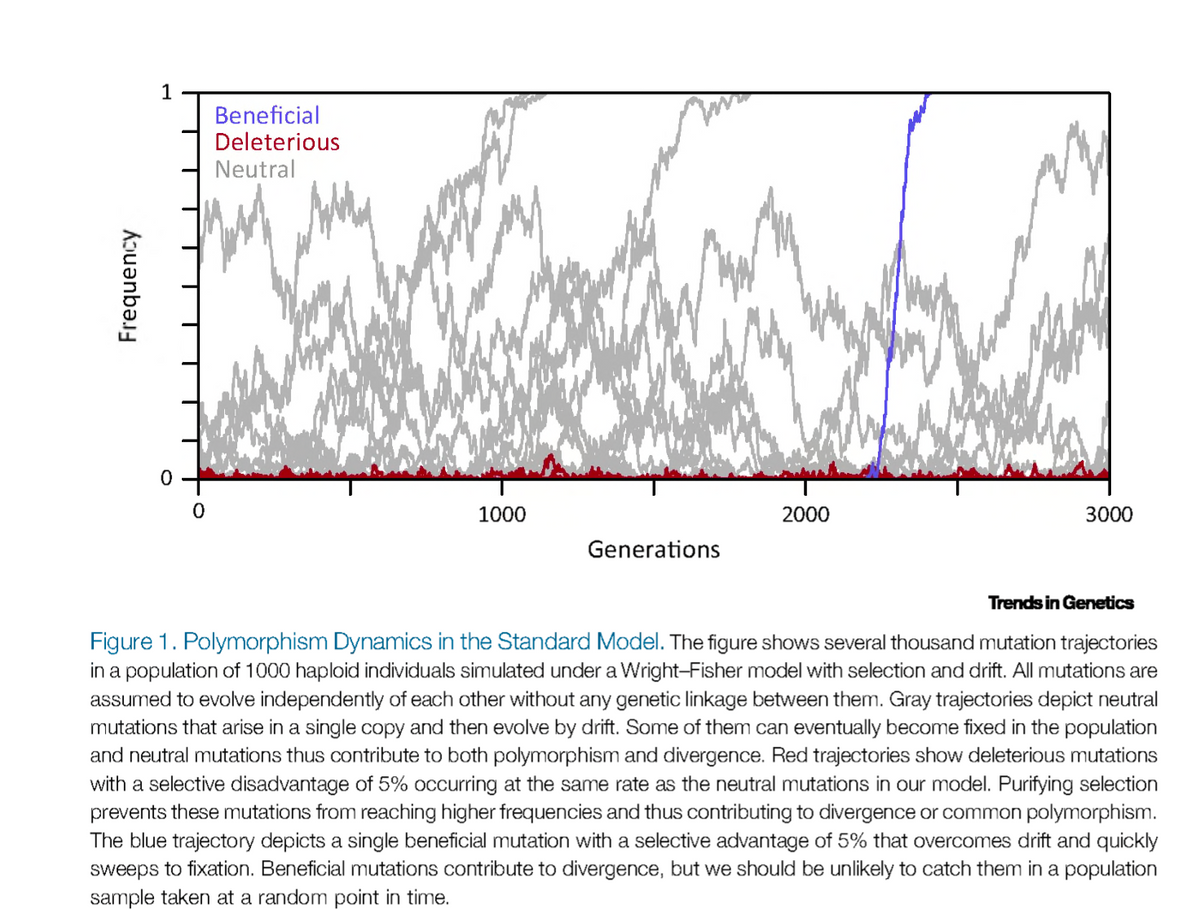
Explain in your own words the predictions of the “standard model of population genetics” as depicted in Figure 1.
Biology (MindTap Course List)
11th Edition
ISBN:9781337392938
Author:Eldra Solomon, Charles Martin, Diana W. Martin, Linda R. Berg
Publisher:Eldra Solomon, Charles Martin, Diana W. Martin, Linda R. Berg
Chapter19: Evolutionary Change In Populations
Section: Chapter Questions
Problem 19TYU
icon
Related questions
Question
  1. Explain in your own words the predictions of the “standard model of population genetics” as depicted in Figure 1.
Frequency
1
0
Beneficial
Deleterious
Neutral
1000
Generations
2000
3000
Trends in Genetics
Figure 1. Polymorphism Dynamics in the Standard Model. The figure shows several thousand mutation trajectories
in a population of 1000 haploid individuals simulated under a Wright-Fisher model with selection and drift. All mutations are
assumed to evolve independently of each other without any genetic linkage between them. Gray trajectories depict neutral
mutations that arise in a single copy and then evolve by drift. Some of them can eventually become fixed in the population
and neutral mutations thus contribute to both polymorphism and divergence. Red trajectories show deleterious mutations
with a selective disadvantage of 5% occurring at the same rate as the neutral mutations in our model. Purifying selection
prevents these mutations from reaching higher frequencies and thus contributing to divergence or common polymorphism.
The blue trajectory depicts a single beneficial mutation with a selective advantage of 5% that overcomes drift and quickly
sweeps to fixation. Beneficial mutations contribute to divergence, but we should be unlikely to catch them in a population
sample taken at a random point in time.
Transcribed Image Text:Frequency 1 0 Beneficial Deleterious Neutral 1000 Generations 2000 3000 Trends in Genetics Figure 1. Polymorphism Dynamics in the Standard Model. The figure shows several thousand mutation trajectories in a population of 1000 haploid individuals simulated under a Wright-Fisher model with selection and drift. All mutations are assumed to evolve independently of each other without any genetic linkage between them. Gray trajectories depict neutral mutations that arise in a single copy and then evolve by drift. Some of them can eventually become fixed in the population and neutral mutations thus contribute to both polymorphism and divergence. Red trajectories show deleterious mutations with a selective disadvantage of 5% occurring at the same rate as the neutral mutations in our model. Purifying selection prevents these mutations from reaching higher frequencies and thus contributing to divergence or common polymorphism. The blue trajectory depicts a single beneficial mutation with a selective advantage of 5% that overcomes drift and quickly sweeps to fixation. Beneficial mutations contribute to divergence, but we should be unlikely to catch them in a population sample taken at a random point in time.
Expert Solution
trending now

Trending now

This is a popular solution!

steps

Step by step

Solved in 2 steps

Blurred answer
Knowledge Booster
Genetic variation
Learn more about
Need a deep-dive on the concept behind this application? Look no further. Learn more about this topic, biology and related others by exploring similar questions and additional content below.
Similar questions
  • SEE MORE QUESTIONS
Recommended textbooks for you
Biology (MindTap Course List)
Biology
ISBN:
9781337392938
Author:
Eldra Solomon, Charles Martin, Diana W. Martin, Linda R. Berg
Publisher:
Cengage Learning