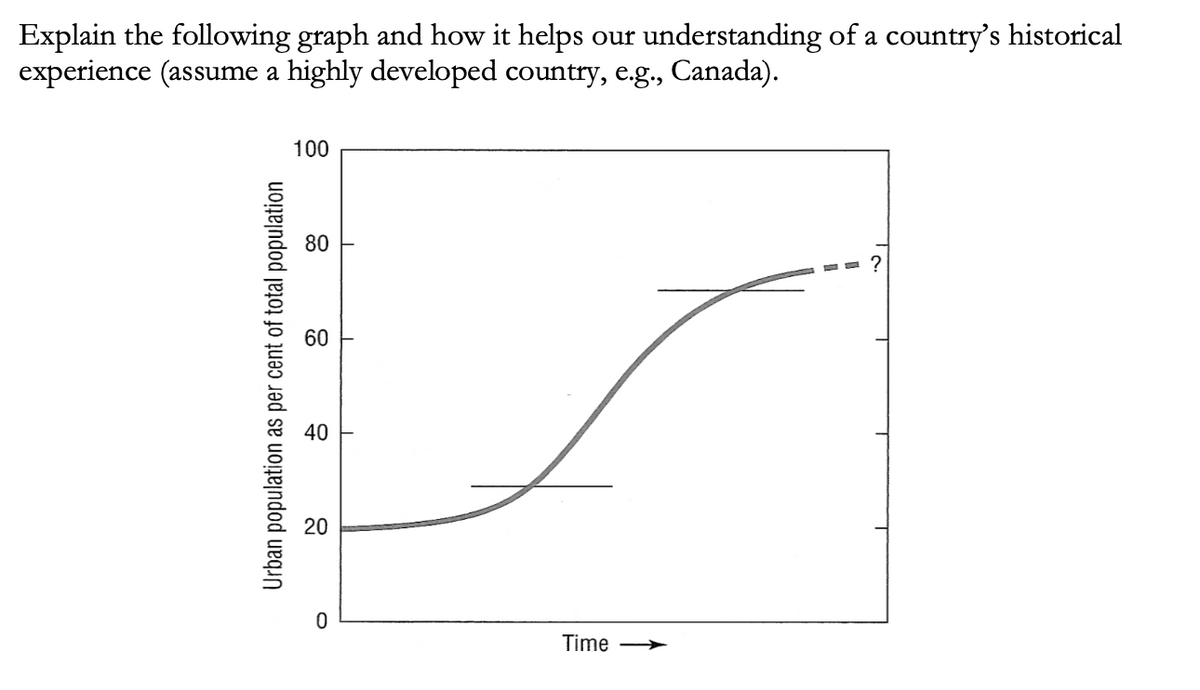
Explain the following graph and how it helps our understanding of a country's historical experience (assume a highly developed country, e.g., Canada). CO 100 80 60 40 20 Time Urban population as per cent of total population


Q: (a) Does the data on Cambodia's GDP per capita in the table correspond approximately to a linear…
A: * SOLUTION :-
Q: C I G NX…
A: Nominal GDP = C + I + G + NX Nominal GDP in the year 1 = 1000 + 156 + 560 +52…
Q: List any three quality of life indicators (table). How do they differ between wealthy and poor…
A: The quality of life refers to the standard or with what circumstances a person lives his life. The…
Q: Consider the production productivity matrix of two goods from the US and India: United States of…
A: Since you have posted a question with multiple sub-parts, we will solve the first three subparts for…
Q: The “graying of America” will substantially increase the fraction of the population that is retired…
A: The percentage increase in average labor productivity from 1960 to 2016 can be calculated as…
Q: Calculate the absolute change in the percent of the world population that lives in India between…
A: The population growth is both a boon and a curse to a nation as it has contradictory effect on its…
Q: rovide a definition of ‘technological capability’ and ‘social capability’ and describe the…
A: “Since you have posted a question with multiple sub-parts, we will solve first three sub-parts for…
Q: 11. The table below shows the average income per person in two countries in 1900 and their…
A: Answer to the question
Q: j. k. 1. puts are known as goods. Most of the income earned in a country is earned by Governments…
A: Note: Since we only answer up to 3 sub-parts, we’ll answer the first 3. Please resubmit the question…
Q: Consider the following data for country A: Population (millions) Real GDP ($ billions) Country A 11…
A: Gross Domestic Product (GDP), the total market value of the products a nation's economy generated…
Q: Today, approximately _______ of the united states population lives in cities
A: The background of US economy The US economy is one of the world's wealthiest and most diverse, with…
Q: Country Population GDP Paraguay 7.045 Million $38,150 Million
A: Gross Domestic Product: It refers o the value of all the final goods and services that are produced…
Q: please identify from the following statements the two valid interpretations. A) The upper-middle…
A: Income disparity refers to how income is distributed unequally across a population. The more unequal…
Q: per capita? a) GDP per capita and growth in GDP per capita rise b) GDP per capita and growth in GDP…
A: From 1346-1353, the black plague ravaged Europe. It is the most deadly pandemic in history, causing…
Q: These data are for illustrative purpose only not in anyway representing Namibia stats in 2019…
A: Since you have posted a question with multiple sub-parts, we will solve the first three sub-parts…
Q: Calculate the proportion of Kumasi for 2021, if the growth rate is 3% per annum and death rate is…
A: The proportion of population of a country keeps changing every year due to various factors that…
Q: The demographic transition refers to: a. The increase in fertility rates and the number of…
A: Fertility rates are an importan population measure that determines the number of children that women…
Q: Logistic population model is given by d P/dt = 10 P (0.2 – P/5000). %3D | Analyze and show how this…
A: Answer - "Thank you for submitting the questions.But, we are authorized to solve only 3 sub…
Q: 100 120 Relar CDP per ega te the S l - 1 In the figure above, GDP per capita relative to the US…
A: GDP: GDP or gross domestic product is the final value of all the goods and services that are…
Q: The horizontal axis of the figure below shows log of real personal income per person in 1880 for 47…
A: Solution- Given in the question -Figure contains the log of real person income in 1880 for 47 us…
Q: Here are some more facts: Participation Capital per (L/Pop) GDP per capita (Y/Pop) 4,148 26,370…
A: Given:
Q: Suppose you are watching a news report with a friend. The news report points out that a certain…
A: Gross Domestic Product per capita means a country's GDP divided by the country's total population.…
Q: Average Average Countr 1820 1870 1920 1970 2010 growth growth (1820- (1920- 2010) 2010) United 1.65…
A: Growth of every country from 1820 to 2010 has been shown in the table below..
Q: 7. What is the name of this chart below? A. Table, B. Curve Line Chart, C. Bar Chart, D. Pie Chart…
A: Chart shows the graphical representation of data.
Q: INSTRUCTION Given the following data for the year 2020, compute for the: Birth rate Death rate…
A: GIVEN: Live births = 300 infants Still births = 5 infants Deaths before 1 month old= 15 infants…
Q: 2. Which of the following is FALSE? none of these are false Poor Americans have more living space,…
A: Here, the primary concept behind the given statements is the poverty in America.
Q: If these population changes were only due to human migration, what conclusions could be made, based…
A: Answer: Introduction: Immigration: Immigration means the movement of people to a foreign country for…
Q: Suppose that there is a country with the following data for the year 2004: Indicator Life Expectancy…
A: The Human Development Index or HDI calculates a country's development through the four factors: mean…
Q: Buggatti is a luxury automobile brand that sells extremely expensive vehicles. The base model of its…
A: The GINI coefficient value lies between zero and one. The value of zero indicates perfect equality…
Q: 2020 Q1 GDP (billions of 2010 NZ Dollars) 63.8 2020 Q1 GDP (billions of 2020Q1 NZ Dollars) 79.2…
A: Nominal GDP measures the value of goods and services at current prices.
Q: Suppose the following data describe a nation's population: Year 1 Year 2 Population 320 million 330…
A: Unemployment rate = (unemployed / labor force) Labor force = Employed + Unemployed…
Q: The following table shows the GDP per capita of country X for 3 years. Year GDP per capita 2015…
A: In this question, we need to calculate the GDP growth rate between the years 2015 to 2016.…
Q: per capita, real U.S. dollars (2000) $50,000 40,000 30,000 20,000 10,000 5,000 1,000 Nigeria Liberia…
A: Involving GDP as a proportion of monetary government assistance or way of life in a nation is…
Q: If two million new bables were born in the U.S. and if two million more immigrants came to the U.S.,…
A: Per capita GDP = Real GDP / Total population
Q: The table below gives the country's GDP, population size, and price level over a three-year period.…
A: (Since you have posted a question with multiple sub parts, we will solve the first three sub parts…
Q: Comment briefly on the advantages and disadvantages of a “ratio scale”.Your answer should focus…
A: The ratio scale possesses all the properties of the nominal, ordinal, and interval scales. It is…
Q: Discuss five (5) negative consequences of population growth
A: Population growth: - Population growth means an increase in the number of persons in a country.
Q: 2020 Q1 GDP (billions of 2010 NZ Dollars) 63.8 2020 Q1 GDP (billions of 2020Q1 NZ Dollars) 79.2…
A: Gross Domestic Product refers to the sum total of goods and services produced within an economy…
Q: Here are some more facts: Participation Capital per (L/Pop) GDP per capita (Y/Pop) 4,148 26,370…
A: The monetary worth of final goods and services produced in a country over a specific period of time…
Q: What is the demographic transition? Contrast the demographic transition view of population growth…
A: The demographic transition refers to a phenomenon of historical shift of some macroeconomic…
Q: In the figure below, which of the lines represents the lowest per-capita rate increase (r)? 500 400…
A: Per capita rate of increase (r) is of population size (N) over some span of your time (t). It are…
Q: QUESTION 5 The table below represents national macroeconomic data for Year 1 and Year 2. Year Y K…
A: Production function : Y=AK0.3N0.7 The term A in the production function represents Total Factor…
Q: Suppose a country's real GDP is $14 trillion and the population is 200 million. Instructions: Enter…
A: Country's real gross domestic product (GDP) is a metric that breaks down a country's economic output…
Q: Match the following terms and definitions.____ a. fertility____ b. crude death rate____ c. crude…
A: "Since you have asked a question with multiple sub-parts, we will solve the first three sub-parts…
Q: We measure standards of living using GDP per capita. Using the production function, which of the…
A: Total production function shows the how each inputs determine the total output For example,…
Q: 10.5 Linear trend (y) 10.0 Log of GDP per capita 9.5 y= 0.0214x + 8.7782 R = 0.9889 9.0 8.5 Year…
A: According to the question, the given graph represents the fitted linear regression line to the log…

Step by step
Solved in 2 steps with 1 images


- A key theme of criticism of globalization is that it seems to unfairly reward the rich and punish the poor. One way to think about this is to look at the issue of income inequality. Technically, income inequality is the unequal distribution of household or individual income across the various participants in an economy. Income inequality is often presented as the percentage of income to a percentage of population. For example, a statistic may indicate that 70% of a country's income is controlled by 20% of that country's residents. Work on income inequality in the USA shows the change in income between 1980 and 2014 for every point on the distribution of people in terms of income percentile that is, we can track the changing distribution of income, from the poorest person to the richest person over that time span. As seen in the chart below, it’s mostly flat and close to zero, before spiking upward at the end—as such, some say it resembles a classic hockey-stick graph. Based on this…Identify ONE way that the data in the chart illustrate global economic differences between countries in the late twentieth century. b) Identify ONE similarity (other than GDP per capita) that might account for the low life expectancies of some of the world’s countries, as displayed in the chart. c) Explain ONE way in which longer life expectancies in some of the world’s countries, as displayed in the chart, have led to new political, economic, or social problems.Conduct a web search and summarize the core-periphery spatial relationshipof each of the four (4) countries being south africa, India, Jamiaca and Brazil.
- These data are for illustrative purpose only not in anyway representing Namibia stats in 2019 2019 Population 2,582,598 Male 1,255,688 Female 1,326,910 Population working age 15+ years Total (PWA) 1,639,205 Labour Force 1,166,464 Employed 776,544 Male employed 386,814 Female employed 390,372 Male labour force 572,891 Female labour force 594,215 Youth labour force 616,988 Youth employed 332,614 Use the information provided in the table above to calculate: a) Labour force participation rate b) Labour force absorption rate c) Namibia unemployment rate in 2019 d) Male absorption rate e) Female absorption rate f) Male…What are the three stages of the demographic transition? For each stagedescribe:a. Is population size increasing or decreasing?b. Is the population growth rate increasing or decreasing?Q6. Explain and compare Pakistan’s HDI score with regional countries. Answer this question with respect to the data mentioned below HDI value HDI rank Life expectancy at birth Expected years of schooling Mean years of schooling GNI per capita (2017 PPP US$) Pakistan 0.557 154 67.3 8.3 5.2 5,005 Bangladesh 0.632 133 72.6 11.6 6.2 4,976 India 0.645 131 69.7 12.2 6.5 6,681 South Asia 0.641 — 69.9 11.7 6.5 6,532 Medium HDI 0.631 — 69.3 11.5 6.3 6,153
- Thomas maltus theory of population and economy10) True or False: Countries that currently have low real GDPs per capita are destined to always have lower living standards than countries that currently have high real GDPs per capita.What is the following formula that could be used for calculating the per capita income of a country??
- Match the following terms and definitions.____ a. fertility____ b. crude death rate____ c. crude birth rate____ d. demography____ e. fecundity____ f. age-specific fertility____ g. age-specific death rate____ h. infant mortality rate____ i. migration____ j. gross migration rate____ k. net migration rate____ l. morbidity(1) the number of deaths per 1,000 members of a population per year(2) the movement of people from one geographical area to another for the purpose of establishing a new residence(3) the increase or decrease per 1,000 members of a population per year as a result of people leaving and enteringthe population(4) the number of live births per 1,000 women aged fifteen to forty-four years(5) the number of deaths per 1,000 persons in a specific age group(6) the study of the growth, distribution, composition, and change of a population(7) the number of live births per 1,000 women in a specific age group(8) the number of persons per 1,000 members of a population who enter or leave…INSTRUCTION Given the following data for the year 2020, compute for the: Birth rate Death rate Maternal mortality rate Fertility rate Infant mortality rate GIVEN: Live births = 300 infants Still births = 5 infants Deaths before 1 month old= 15 infants Women in their reproductive age = 2,000 women Total Population = 10,000 people Deaths = 100 people (across all age groups)Using the information provided in Table 1 below for the Traditional Human Development Index, answer the following questions: Hypothetical Data for Malaysia Economic Indictor Value PPP GDP per capita $ 13,990 Life Expectancy 79 Adult literacy 86% Gross School Enrollment 82% Calculate the income index, life expectancy index, and education index for Malaysia .

