False alarm: The numbers of false fire alarms were counted each month at a number of sites. The results are given in the following table. Month Number of Alarms January 32 February 15 March 37 38 April May 45 June 48 July August 46 42 September 34 October 36 November 28 December 26 Source: Journal of Architectural Engineering 5:62-65 Test the hypothesis that false alarms are equally likely to occur in any month. Use the a = 0.01 level of
False alarm: The numbers of false fire alarms were counted each month at a number of sites. The results are given in the following table. Month Number of Alarms January 32 February 15 March 37 38 April May 45 June 48 July August 46 42 September 34 October 36 November 28 December 26 Source: Journal of Architectural Engineering 5:62-65 Test the hypothesis that false alarms are equally likely to occur in any month. Use the a = 0.01 level of

Holt Mcdougal Larson Pre-algebra: Student Edition 2012
1st Edition
ISBN:9780547587776
Author:HOLT MCDOUGAL
Publisher:HOLT MCDOUGAL
Chapter11: Data Analysis And Probability
Section: Chapter Questions
Problem 8CR

Related questions
Topic Video
Question
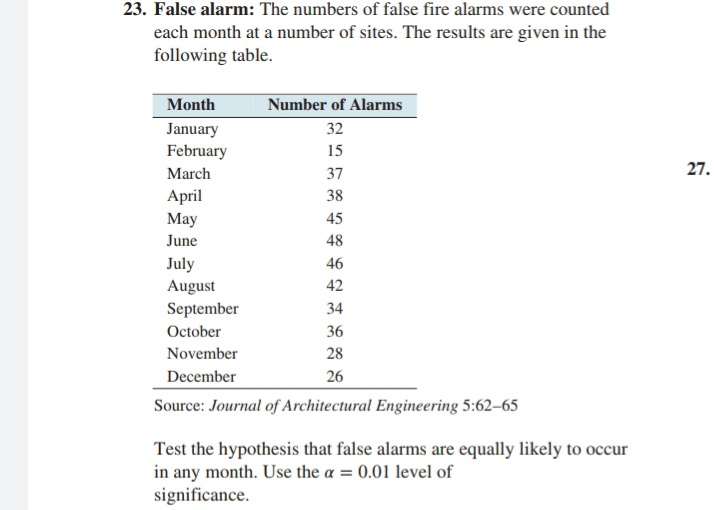
Transcribed Image Text:23. False alarm: The numbers of false fire alarms were counted
each month at a number of sites. The results are given in the
following table.
Month
Number of Alarms
32
January
February
15
March
37
27.
April
38
May
45
June
48
July
August
46
42
September
34
October
36
November
28
December
26
Source: Journal of Architectural Engineering 5:62–65
Test the hypothesis that false alarms are equally likely to occur
in any month. Use the a = 0.01 level of
significance.
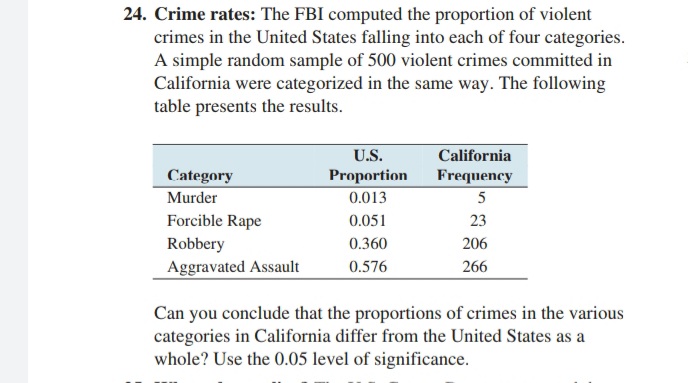
Transcribed Image Text:24. Crime rates: The FBI computed the proportion of violent
crimes in the United States falling into each of four categories.
A simple random sample of 500 violent crimes committed in
California were categorized in the same way. The following
table presents the results.
U.S.
California
Category
Proportion
Frequency
Murder
0.013
5
Forcible Rape
0.051
23
Robbery
0.360
206
Aggravated Assault
0.576
266
Can you conclude that the proportions of crimes in the various
categories in California differ from the United States as a
whole? Use the 0.05 level of significance.
Expert Solution
This question has been solved!
Explore an expertly crafted, step-by-step solution for a thorough understanding of key concepts.

This is a popular solution!

Trending now
This is a popular solution!

Step by step
Solved in 2 steps with 1 images

Knowledge Booster


Learn more about
Need a deep-dive on the concept behind this application? Look no further. Learn more about this topic, statistics and related others by exploring similar questions and additional content below.Recommended textbooks for you
Holt Mcdougal Larson Pre-algebra: Student Edition…
Algebra
ISBN:
9780547587776
Author:
HOLT MCDOUGAL
Publisher:
HOLT MCDOUGAL

College Algebra (MindTap Course List)
Algebra
ISBN:
9781305652231
Author:
R. David Gustafson, Jeff Hughes
Publisher:
Cengage Learning
Holt Mcdougal Larson Pre-algebra: Student Edition…
Algebra
ISBN:
9780547587776
Author:
HOLT MCDOUGAL
Publisher:
HOLT MCDOUGAL
College Algebra (MindTap Course List)
Algebra
ISBN:
9781305652231
Author:
R. David Gustafson, Jeff Hughes
Publisher:
Cengage Learning