find the critical value. compute the test satistic. what is the conclusion based off of the hypothesis test?
find the critical value. compute the test satistic. what is the conclusion based off of the hypothesis test?

Glencoe Algebra 1, Student Edition, 9780079039897, 0079039898, 2018
18th Edition
ISBN:9780079039897
Author:Carter
Publisher:Carter
Chapter10: Statistics
Section10.6: Summarizing Categorical Data
Problem 30PPS

Related questions

Question
find the critical value.
compute the test satistic.
what is the conclusion based off of the hypothesis test?
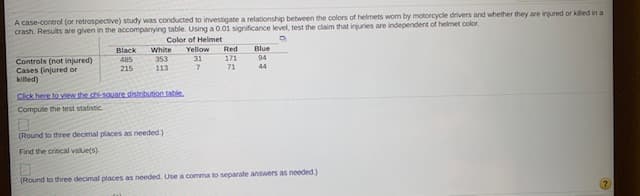
Transcribed Image Text:A case-control (or retrospective) study was conducted to investigate a relationship between the colors of helmets worn by motorcycle drivers and whether they are injured or killed in a
crash. Results are given in the accompanying table. Using a0.01 significance level, test the claim that injuries are independent of helmet color.
Color of Helmet
Blue
94
Yellow
Red
White
353
113
Black
171
71
31
Controls (not injured)
Cases (injured or
killed)
485
215
44
Click here to view the chi-square distribution table
Compute the test statistic.
(Round to three decimal places as needed.)
Find the critical value(s)
(Round to three decimal places as needed. Use a comma to separate answers as needed)
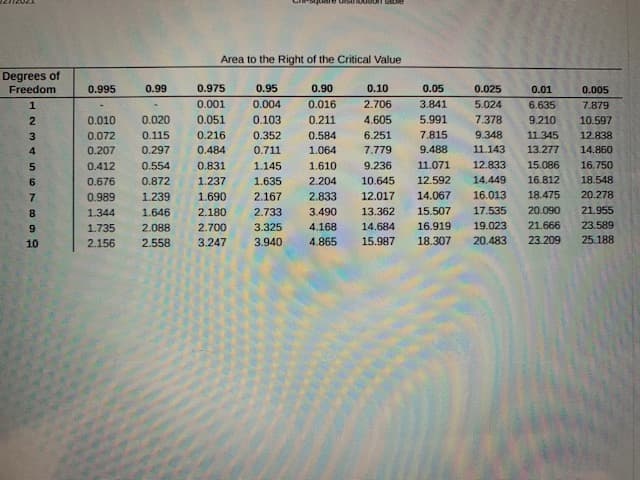
Transcribed Image Text:Area to the Right of the Critical Value
Degrees of
Freedom
0.995
0.99
0.975
0.95
0.90
0.10
0.05
0.025
0.01
0.005
1
0.001
0.004
0.016
2.706
3.841
5.024
6.635
7.879
2
0.010
0.020
0.051
0.103
0.211
4.605
5.991
7.378
9.210
10.597
0.072
0.115
0.216
0.352
0.584
6.251
7.815
9.348
11.345
12.838
4
0.207
0.297
0.484
0.711
1.064
7.779
9.488
11.143
13.277
14.860
5.
0.412
0.554
0.831
1.145
1.610
9.236
11.071
12.833
15.086
16.750
6.
0.676
0.872
1.237
1.635
2.204
10.645
12.592
14.449
16.812
18.548
7.
0.989
1.239
1.690
2.167
2.833
12.017
14.067
16.013
18.475
20.278
8.
1.344
1.646
2.180
2.733
3.490
13.362
15.507
17.535
20.090
21.955
1.735
2.088
2.700
3.325
4.168
14.684
16.919
19.023
21.666
23.589
10
2.156
2.558
3.247
3.940
4.865
15.987
18.307
20.483
23.209
25.188
Expert Solution
This question has been solved!
Explore an expertly crafted, step-by-step solution for a thorough understanding of key concepts.

Step by step
Solved in 4 steps

Knowledge Booster


Learn more about
Need a deep-dive on the concept behind this application? Look no further. Learn more about this topic, statistics and related others by exploring similar questions and additional content below.Recommended textbooks for you
Glencoe Algebra 1, Student Edition, 9780079039897…
Algebra
ISBN:
9780079039897
Author:
Carter
Publisher:
McGraw Hill

College Algebra (MindTap Course List)
Algebra
ISBN:
9781305652231
Author:
R. David Gustafson, Jeff Hughes
Publisher:
Cengage Learning
Glencoe Algebra 1, Student Edition, 9780079039897…
Algebra
ISBN:
9780079039897
Author:
Carter
Publisher:
McGraw Hill
College Algebra (MindTap Course List)
Algebra
ISBN:
9781305652231
Author:
R. David Gustafson, Jeff Hughes
Publisher:
Cengage Learning