
A First Course in Probability (10th Edition)
10th Edition
ISBN: 9780134753119
Author: Sheldon Ross
Publisher: PEARSON
expand_more
expand_more
format_list_bulleted
Related questions
Concept explainers
Topic Video
Question
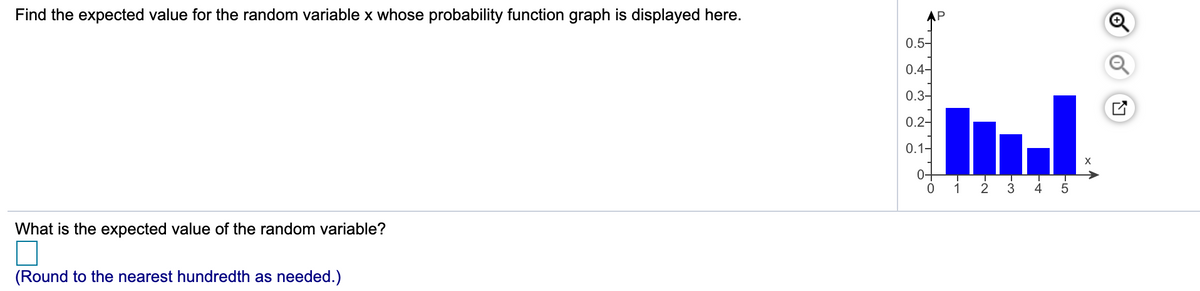

Transcribed Image Text:Find the expected value for the random variable x whose probability function graph is displayed here.
AP
0.5-
0.4-
0.3-
0.2-
0.1-
0+
1
3
4
What is the expected value of the random variable?
(Round to the nearest hundredth as needed.)
Expert Solution
This question has been solved!
Explore an expertly crafted, step-by-step solution for a thorough understanding of key concepts.

This is a popular solution

Trending nowThis is a popular solution!

Step by stepSolved in 2 steps

Knowledge Booster


Learn more about
Need a deep-dive on the concept behind this application? Look no further. Learn more about this topic, probability and related others by exploring similar questions and additional content below.Similar questions
- ch8 q11arrow_forwardFive males with an X-linked genetic disorder have one child each. The random variable x is the number of children among the five who inherit the X-linked genetic disorder. Determine whether a probability distribution is given. If a probability distribution is given, find its mean and standard deviation. If a probability distribution is not given, identify the requirements that are not satisfied. child(ren) (Round to one decimal place as needed.) X 0 1 2 3 4 5 Does the table show a probability distribution? Select all that apply. A. Yes, the table shows a probability distribution. B. No, the random variable x's number values are not associated with probabilities. C. No, the random variable x is categorical instead of numerical. D. No, not every probability is between 0 and 1 inclusive. E. No, the sum of all the probabilities is not equal to 1. Find the mean of the random variable x. Select the correct choice below and, if necessary, fill in the answer box to complete your choice. P(x)…arrow_forwardHow to commute the followingarrow_forward
- Use the probability distribution for the random variable x to answer the question. Find p(4). 0 p(x) 0.2 X 1 2 3 0.25 0.3 0.1 4 5 ? 0.05arrow_forwardThe chance of an IRS audit for a tax return with over $25,000 in income is about 2% per year. We are interested in the expected number of audits a person with that income has in a 16-year period. Assume each year is independent. Part (a) Part (b) List the values that X may take on. X=0, 1, 2,..., 15, 16 OX= 1, 2, 3, OX= 1, 2, 3, OX=1,2,3,... 15, 16 98, 99, 100 Part (c) Give the distribution of X X-B 0.02 □ Part (d) How many audits are expected in a 16-year period? (Round your answer to two decimal places.) 0.32 audits Part (e) Find the probability that a person is not audited at all. (Round your answer to four decimal places.) Part (1) Find the probability that a person is audited more than twice. (Round your answer to four decimal places.)arrow_forwardHere is the probability model for the blood type of a randomly chosen person in the United States. Blood type O A B AB Probability 0.53 0.22 0.06 0.19 What is the probability that a randomly chosen American does not have type O blood? ______________% Round to the nearest 0.01%arrow_forward
- Subject- Statistics and Probability Instruct. The random variable X represents the number of defective bulbs when 3 bulbs are tested. The probability distribution is shown below. X 0 1 2 3 P(x) 0.95 0.03 0.01 0,01 Now, find the probability of at least 1 found defective.arrow_forwardIf the probability distribution for the random variable X is given in the table, what is the expected value of X? Xi - 5 1 5 Pi .3 .5 .2 LOarrow_forwardFill in the P(X=x) values to give a legitimate probability distribution for the discrete random variable X, whose possible values are -4,-2,3,5, and 6.arrow_forward
- How do I find the mean?arrow_forwardDo you carpool? Let X represent the number of occupants in a randomly chosen car on a certain stretch of highway during morning commute hours. A survey of cars showed that the probability distribution of X is as follows. x 1 2 3 4 5 Px 0.68 0.14 0.08 0.02 0.08 Send data to Excel Part 1 of 7 (a) Find P1 . P1 = .68 Part 2 of 7 (b) Find P (greater than or equal to 2 ). P (greater than or equal to 2 ) = .32 Part 3 of 7 (c) Find the probability that a car has only one occupant. The probability that a car has only one occupant is . Part 4 of 7 (d) Find the probability that a car has fewer than four occupants. The probability that a car has fewer than four occupants is . Part 5 of 7 (e) Compute the mean μx .…arrow_forwardJust complete sub parts d,e, and farrow_forward
arrow_back_ios
arrow_forward_ios
Recommended textbooks for you
- A First Course in Probability (10th Edition)ProbabilityISBN:9780134753119Author:Sheldon RossPublisher:PEARSON

A First Course in Probability (10th Edition)
Probability
ISBN:9780134753119
Author:Sheldon Ross
Publisher:PEARSON