Find the General weighted average of Jerry on the First semester. Course Course Grade Course Units English 1.50 3 4.5 Anthropology 2.25 3 6.75 Chemistry 2.00 48 Calculus 2.00 36 Physical 1.50 23 Education
Find the General weighted average of Jerry on the First semester. Course Course Grade Course Units English 1.50 3 4.5 Anthropology 2.25 3 6.75 Chemistry 2.00 48 Calculus 2.00 36 Physical 1.50 23 Education

Glencoe Algebra 1, Student Edition, 9780079039897, 0079039898, 2018
18th Edition
ISBN:9780079039897
Author:Carter
Publisher:Carter
Chapter10: Statistics
Section10.5: Comparing Sets Of Data
Problem 14PPS

Related questions
Question
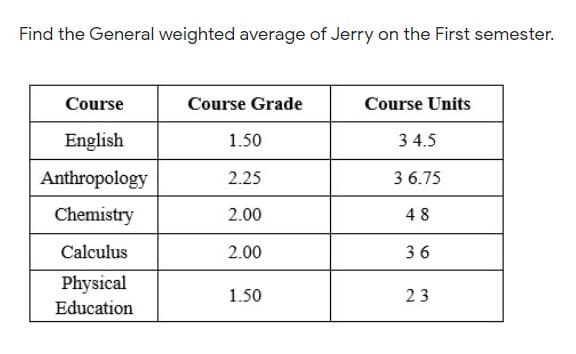
Transcribed Image Text:Find the General weighted average of Jerry on the First semester.
Course
Course Grade
Course Units
English
1.50
3 4.5
Anthropology
2.25
3 6.75
Chemistry
2.00
48
Calculus
2.00
36
Physical
1.50
23
Education
Expert Solution
This question has been solved!
Explore an expertly crafted, step-by-step solution for a thorough understanding of key concepts.

Step by step
Solved in 2 steps with 2 images

Recommended textbooks for you
Glencoe Algebra 1, Student Edition, 9780079039897…
Algebra
ISBN:
9780079039897
Author:
Carter
Publisher:
McGraw Hill
Glencoe Algebra 1, Student Edition, 9780079039897…
Algebra
ISBN:
9780079039897
Author:
Carter
Publisher:
McGraw Hill