Find the regression equation, letting overhead width be the predictor (x) variable. Find the best predicted weight of a seal if the overhead width measured from a photograph is 2.2 cm. Can the prediction be correct? wrong with predicting the weight in this case? Use a significance level of 0.05. 9.7 8.3 203 Overhead Width (cm) 7.4 9.8 8.2 7.9 295 219 1 Critical Values of the Pearson Correlation Coefficient r Weight (kg) 192 264 212 A Click the icon to view the critical values of the Pearson correlation coefficient r. a= 0.05 NOTE: To test Ho: p = 0 |against H,: p# 0, reject H, lif the absolute value of r is greater than the critical ]value in the table. In a= 0.01 The regression equation is y =O+Dx. (Round to one decimal place as needed.) 4 5 0.990 0.959 0.950 0.878 0.811 0.754 0.707 |0.666 0.632 6 17 0.917 0.875 0.834 0.798 0.765 9 10
Find the regression equation, letting overhead width be the predictor (x) variable. Find the best predicted weight of a seal if the overhead width measured from a photograph is 2.2 cm. Can the prediction be correct? wrong with predicting the weight in this case? Use a significance level of 0.05. 9.7 8.3 203 Overhead Width (cm) 7.4 9.8 8.2 7.9 295 219 1 Critical Values of the Pearson Correlation Coefficient r Weight (kg) 192 264 212 A Click the icon to view the critical values of the Pearson correlation coefficient r. a= 0.05 NOTE: To test Ho: p = 0 |against H,: p# 0, reject H, lif the absolute value of r is greater than the critical ]value in the table. In a= 0.01 The regression equation is y =O+Dx. (Round to one decimal place as needed.) 4 5 0.990 0.959 0.950 0.878 0.811 0.754 0.707 |0.666 0.632 6 17 0.917 0.875 0.834 0.798 0.765 9 10

Glencoe Algebra 1, Student Edition, 9780079039897, 0079039898, 2018
18th Edition
ISBN:9780079039897
Author:Carter
Publisher:Carter
Chapter4: Equations Of Linear Functions
Section: Chapter Questions
Problem 4SGR

Related questions

Question
please see attached - thank you in advance
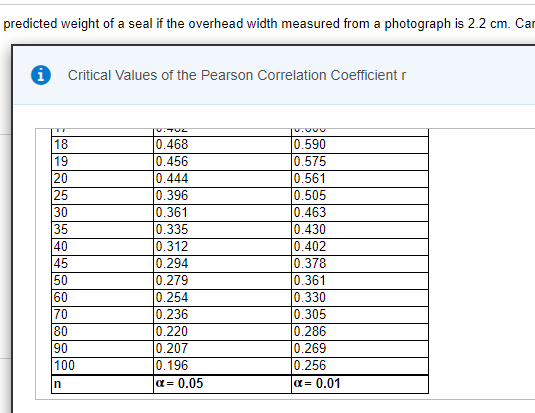
Transcribed Image Text:predicted weight of a seal if the overhead width measured from a photograph is 2.2 cm. Car
Critical Values of the Pearson Correlation Coefficient r
0.402
0.000
0.468
0.456
0.444
0.396
0.590
0.575
0.561
0.505
0.463
0.430
0.402
0.378
18
19
20
25
30
35
40
45
50
60
70
0.361
0.335
0.312
0.294
0.279
0.254
0.236
0.220
0.207
0.196
0.361
0.330
0.305
0.286
0.269
0.256
80
90
100
In
a= 0.05
a= 0.01
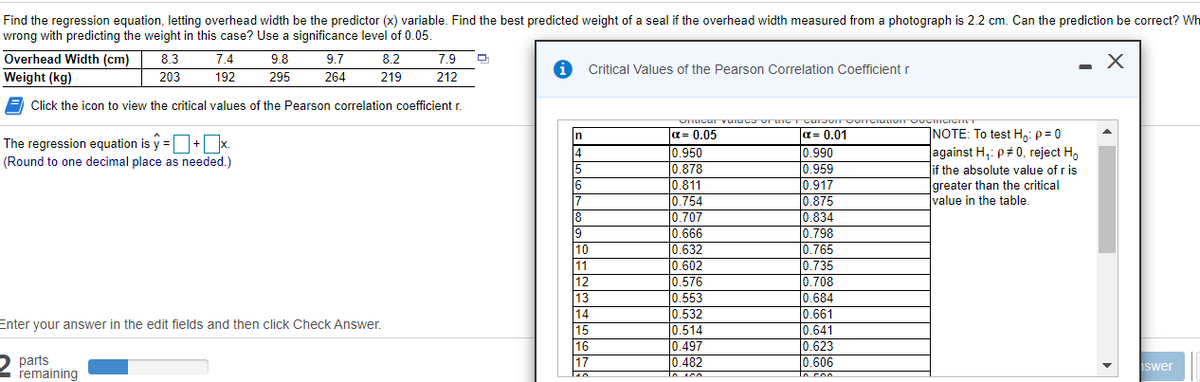
Transcribed Image Text:Find the regression equation, letting overhead width be the predictor (x) variable. Find the best predicted weight of a seal if the overhead width measured from a photograph is 2.2 cm. Can the prediction be correct? Wh
wrong with predicting the weight in this case? Use a significance level of 0.05
Overhead Width (cm)
Weight (kg)
8.3
203
7.4
9.8
9.7
8.2
7.9
Critical Values of the Pearson Correlation Coefficient r
192
295
264
219
212
Click the icon to view the critical values of the Pearson correlation coefficient r.
a= 0.05
0.950
10.878
INOTE: To test H: p = 0
against H,: p# 0, reject H,
if the absolute value of r is
greater than the critical
Ivalue in the table.
n
a= 0.01
The regression equation is y =O+x.
14
15
16
0.990
0.959
(Round to one decimal place as needed.)
0.811
0.754
0.707
0.666
0.632
0.602
0.576
0.553
0.917
0.875
8
19
10
11
12
13
0.834
0.798
0.765
0.735
0.708
0.684
0.661
0.641
0.623
|0.606
to con
14
0.532
Enter your answer in the edit fields and then click Check Answer.
15
16
17
0.514
0.497
0.482
to sco
parts
remaining
iswer
Loico
Expert Solution
This question has been solved!
Explore an expertly crafted, step-by-step solution for a thorough understanding of key concepts.

This is a popular solution!

Trending now
This is a popular solution!

Step by step
Solved in 2 steps with 2 images

Knowledge Booster


Learn more about
Need a deep-dive on the concept behind this application? Look no further. Learn more about this topic, statistics and related others by exploring similar questions and additional content below.Recommended textbooks for you
Glencoe Algebra 1, Student Edition, 9780079039897…
Algebra
ISBN:
9780079039897
Author:
Carter
Publisher:
McGraw Hill

Big Ideas Math A Bridge To Success Algebra 1: Stu…
Algebra
ISBN:
9781680331141
Author:
HOUGHTON MIFFLIN HARCOURT
Publisher:
Houghton Mifflin Harcourt

Algebra and Trigonometry (MindTap Course List)
Algebra
ISBN:
9781305071742
Author:
James Stewart, Lothar Redlin, Saleem Watson
Publisher:
Cengage Learning
Glencoe Algebra 1, Student Edition, 9780079039897…
Algebra
ISBN:
9780079039897
Author:
Carter
Publisher:
McGraw Hill
Big Ideas Math A Bridge To Success Algebra 1: Stu…
Algebra
ISBN:
9781680331141
Author:
HOUGHTON MIFFLIN HARCOURT
Publisher:
Houghton Mifflin Harcourt
Algebra and Trigonometry (MindTap Course List)
Algebra
ISBN:
9781305071742
Author:
James Stewart, Lothar Redlin, Saleem Watson
Publisher:
Cengage Learning