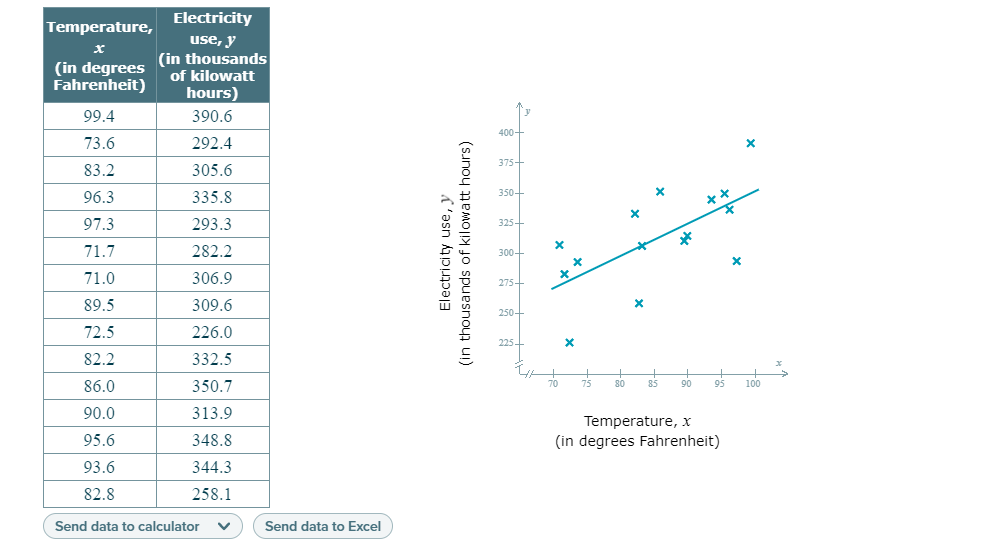
Based on the sample data and the regression line, complete the following. The managers of an electric utility wish to examine the relationship between temperature and electricity use in the utility's service region during the summer months. In particular, the managers wish to be able to predict total electricity use for a day from the maximum temperature that day. The bivariate data below give the maximum temperature (in degrees Fahrenheit) and the electricity use (in thousands of kilowatt hours) of electricity generated and sold for a random sample of summer days. A best-fitting line for the data, obtained from least-squares regression, is given by =y+83.852.67x, in which x denotes the maximum temperature and y denotes the electricity use. This line is shown in the scatter plot below. (a)For these data, values for electricity use that are greater than the mean of the values for electricity use tend to be paired with temperature values that are ▼(Choose one) the mean of the temperature values. (b)According to the regression equation, for an increase of one degree Fahrenheit in temperature, there is a corresponding increase of how many thousands of kilowatt hours in electricity use? (c)What was the observed electricity use (in thousands of kilowatt hours) when the temperature was 99.4 degrees Fahrenheit?


Correlation
Correlation defines a relationship between two independent variables. It tells the degree to which variables move in relation to each other. When two sets of data are related to each other, there is a correlation between them.
Linear Correlation
A correlation is used to determine the relationships between numerical and categorical variables. In other words, it is an indicator of how things are connected to one another. The correlation analysis is the study of how variables are related.
Regression Analysis
Regression analysis is a statistical method in which it estimates the relationship between a dependent variable and one or more independent variable. In simple terms dependent variable is called as outcome variable and independent variable is called as predictors. Regression analysis is one of the methods to find the trends in data. The independent variable used in Regression analysis is named Predictor variable. It offers data of an associated dependent variable regarding a particular outcome.
The managers of an electric utility wish to examine the relationship between temperature and electricity use in the utility's service region during the summer months. In particular, the managers wish to be able to predict total electricity use for a day from the maximum temperature that day. The bivariate data below give the maximum temperature (in degrees Fahrenheit) and the electricity use (in thousands of kilowatt hours) of electricity generated and sold for a random sample of summer days. A best-fitting line for the data, obtained from least-squares regression, is given by =y+83.852.67x, in which x denotes the maximum temperature and y denotes the electricity use. This line is shown in the
|


Trending now
This is a popular solution!

Step by step
Solved in 2 steps


