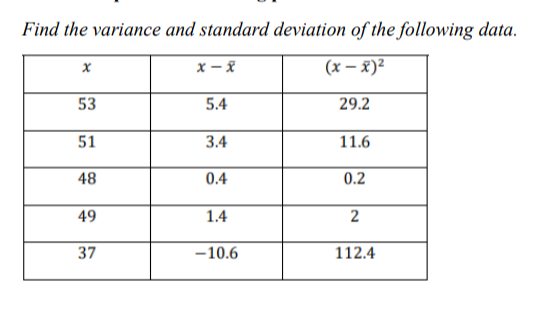
Find the variance and standard deviation of the following data. x - x (x – x)² 53 5.4 29.2 51 3.4 11.6 48 0.4 0.2 49 1.4 2 37 -10.6 112.4


Q: Q2 – For the data in table (1). - 1- Draw the frequency distribution diagram. 2 - Find the class…
A:
Q: 1.Find The standard deviation if the variances are: a.s? = 2.25 b.s? = 3.24 C.s? = 7.29 %3D S = S =…
A: Given (a) S2=2.25 (b) S2=3.24 (C) S2=7.29
Q: Q4: For the following data, if the coefficient of variance (C.V) and the standard deviation (SD) are…
A: It is given that the coefficient of variance is 13.9321 and the standard deviation is 2.4381. Using…
Q: Gracia, an ALS student, obtained a z-score of 1.35 in an achievement test that is normally…
A: Given : Z-score=1.35 Mean=85 Standard deviation =5
Q: What is the Variance of a geometric distribution having parameter p-0.24? Select one: a. 4.167 b.…
A: We have find variance distribution...
Q: Which one of the following relation between standard deviation (S.D.) and variance Var (: variable X…
A: What is the relationship between standard deviation and Variance?
Q: Consider the following data. Find the variance. Round your answer to one decimal place.
A: Answer:- Given probability mass function of X x -5 -4 -3 -2 -1 P(X = x) 0.2 0.3 0.2 0.1 0.2…
Q: The following are some of the particulars of the distribution of weight of boys and girls in a class…
A:
Q: P(x) x. P(x) r. P(x) X2 15 0.30 4.5 18 0.20 3.6 19 0.20 3.8 20 0.15 3 22 0.15 3.3 Solve for mean,…
A:
Q: The distribution of chocolate chips (x) in a cookie is shown in the following table. Find the mean,…
A: Given the distribution of chocolate chips X in a cookie . To find Mean, Variance & Standard…
Q: Which amongst the following is not required to find Karl pearson coefficient of correlation? Select…
A:
Q: Find the variance of the following data. Round your answer to one decimal place. 7 8. 9. 10 11 P(X =…
A: Given that, X 7 8 9 10 11 P(X=x) 0.3 0.2 0.1 0.2 0.2
Q: The range and the variance are both measures of distance.
A: Solution-: The range and the variance are both measures of distance.
Q: The following table contains the probability distribution for the number of traffic accidents daily…
A: Obtain the value of the standard deviation. The value of the standard deviation is obtained below as…
Q: Q2 : A: Find the standard deviation and variance of the following data classes 10- 13- 16- 19-22…
A: Given data is Classes 10- 13- 16- 19-22 frequency 4 12 20 14 Class width = Upper class limit…
Q: Which of the following is the best approximation of the standard deviation of the normal curve shown…
A: which of the following is the best approximation of the standard deviation of the normal curve shown…
Q: The numbers of absent days a student had in the last five months are {0, 4, 2, 0, 3}. What is the…
A:
Q: X represents the number of tires that were underinflated. P(X) .30 1 .25 .25 .15 4 .05 A. Compute…
A: as per our company guidelines we are supposed to answer only first 3 sub-parts. Kindly repost other…
Q: Find the variance of the following data. Round your answer to one decimal place.
A: Our aim is to find the variance.
Q: Which of the following better approximates the variance of the sample means? b. 4. VN-n N-1 a. 4 vn
A: Varince is the measure of dispersion. It used to understand the variance of each observation from…
Q: Use the data set of exam scores from a simple random sample of students. 50 71 89 83 73 73 81 72 30…
A:
Q: Q4/A:The following data represent the number of damaged pieces of spare parts for the production of…
A:
Q: Suppose P(X E {1,2,3})=1 and E(X) =2.5. What is the smallest and largest possible values for the…
A: P(x=i) =pi where i = 1,2,3 Since P(X belongs to {1,2,3}), p1+p2+p3 = 1…
Q: 9. Calculate the standard deviation and variance from the following data. (x-x) Values (X) X-X 14 -1…
A: Solution is given. Hope my answer is helpful.
Q: his data is from a sample. Calculate the mean, standard deviation, and variance. x 49 11.9 30.7…
A: WE have to compute Mean, standard deviation and variance from the sample data The sample data are…
Q: e. What is the variance of X? f. What is the standard deviation of X? е.
A:
Q: Which of the following are the mean and standard deviation of Y?
A: The mean and Standard deviation for random variable X are 5 and 2.3 respectively.
Q: X P(x) 1 1/5 2 1/5 3 1/5 4 1/5 5 1/5 6 1/5
A: Given data is x 1 2 3 4 5 6 P(x) 1/5 1/5 1/5 1/5 1/5 1/5
Q: Q1 (a) Calculate the standard deviation of the following data. 11.7 | 12.3 | 11.5 | 16.8 | 19.4 |…
A:
Q: 3) Which of the following is a biased estimator? 3) A) variance B) standard deviation C) mean D)…
A: which of the following is biased estimator
Q: The 2019 gross sales of all car companies in the country have a mean of 2.3 billion pesos and a…
A: Given, Mean(X)=2.3 Standard Deviation(s)=0.6
Q: A barber expects to get between zero and six customers per hour in his barber shop. The probability…
A: Solution-: We have following table: X P(X) 0 0.15 1 0.07 2 0.29 3 0.26 4 0.13 5 0.09…
Q: Which of the following better approximates the variance of the sample means? b. . N-1 a. 4
A:
Q: The following table contains the probability distribution for the number of traffic accidents daily…
A: Mean, E[X] = 1.68 (already found) E[X2] = ∑i x2p(x) =…
Q: T'he mean and standard deviation of a set of 100 observations were worked out as 40 and 5…
A:
Q: Which of the following better approximates the variance of the sample means? a. 4 b. 2. VN-n Vn N-1
A: here given, σ = population standard deviation N= population size n= sample size
Q: Q4/4:The following data represent the number of damaged pieces of spare parts for the production of…
A:
Q: (1) The mean and variance of y, are, respectively,
A: by bartleby policy i can give only one question at time. so ,sorry for 2nd question
Q: Compute the Variance and standard deviation of the given table 4d? Class Intervals 1-10 11-20 21-30…
A: Solution: Class interval Frequency (f) Midpoint(x) x^2 fx fx2 1 -10 4 5.5 30.25 22 121 11-20…
Q: Histogram: fines paid by drivers 12 10 4. 1 2 3 More Number of fines paid a year by a driver Compute…
A:
Q: Below is a frequency distribution Classes 0-14 4. 15 - 29 18 30-44 12 45 - 59 7 60- 74 5n 75-89 1…
A:
Q: Q1) The following data represent the difference in scores between the winning and losing teams in a…
A: Point Difference (interval) Frequency(f) Mid value (x) (f)(x) (fx2) 1 – 5 8…
Q: Q.4 Calculate the Variance and standard deviation from the following data Daily wages (Rs.) 400-450…
A: Concentration of all the values around the central value of the given data is known as measures of…
Q: the standard deviation of a sample of 50 observations equals 10. the variance of the sample equals?…
A:
Q: What is the variance of X in the following data? -2 | -1 | 0 | 1 | 2 | 3 -3 -1 -2 4 Select one: 17.5…
A:
Q: Q6/ Calculate mean, variance and standard deviation of following table: classes frequency 1-10 11…
A: To calculate mean, variance and standard deviation of the following table. classes frequency…
Q: Match each the following statistics to the appropriate test: ratio of variances for two d. a. t-test…
A: Explanation: t-test: t-test is used when two samples from normal population and population variance…
Q: Consider the distribution below. Compute for the mean and variance. X 0 10 20 30 40 50 P(x) 5% 5%…
A: According to the given information, we have The probability distribution table is given. X 0 10…
Q: s given by the following table. 4 6. 7. 8. P(x) 0.04 0.10 0.13 0.30 0.29 0.12 0.01 0.01 (a) Find the…
A: Hello! As you have posted more than 3 sub parts, we are answering the first 3 sub-parts. In case…
Q: What is the standart- deviation of Y in the following data? a | -2 | -1 | 0|1| 2 | 3 -3 -1 -2 Select…
A: Working: y (y-ybar)^2 -3 9 -2 4 -1 1 0 0 4 16 2 4

Step by step
Solved in 2 steps with 2 images
