First regression: wage = ß1 + B2educ + ßzexper + B4(educ X exper) + e Second regression: wage = ß1 + Bzeduc + Bzexper + e %3D where wage denotes hourly wages. We estimate both regressions in R and obtain the output:
First regression: wage = ß1 + B2educ + ßzexper + B4(educ X exper) + e Second regression: wage = ß1 + Bzeduc + Bzexper + e %3D where wage denotes hourly wages. We estimate both regressions in R and obtain the output:

Managerial Economics: Applications, Strategies and Tactics (MindTap Course List)
14th Edition
ISBN:9781305506381
Author:James R. McGuigan, R. Charles Moyer, Frederick H.deB. Harris
Publisher:James R. McGuigan, R. Charles Moyer, Frederick H.deB. Harris
Chapter4: Estimating Demand
Section: Chapter Questions
Problem 8E

Related questions
Question
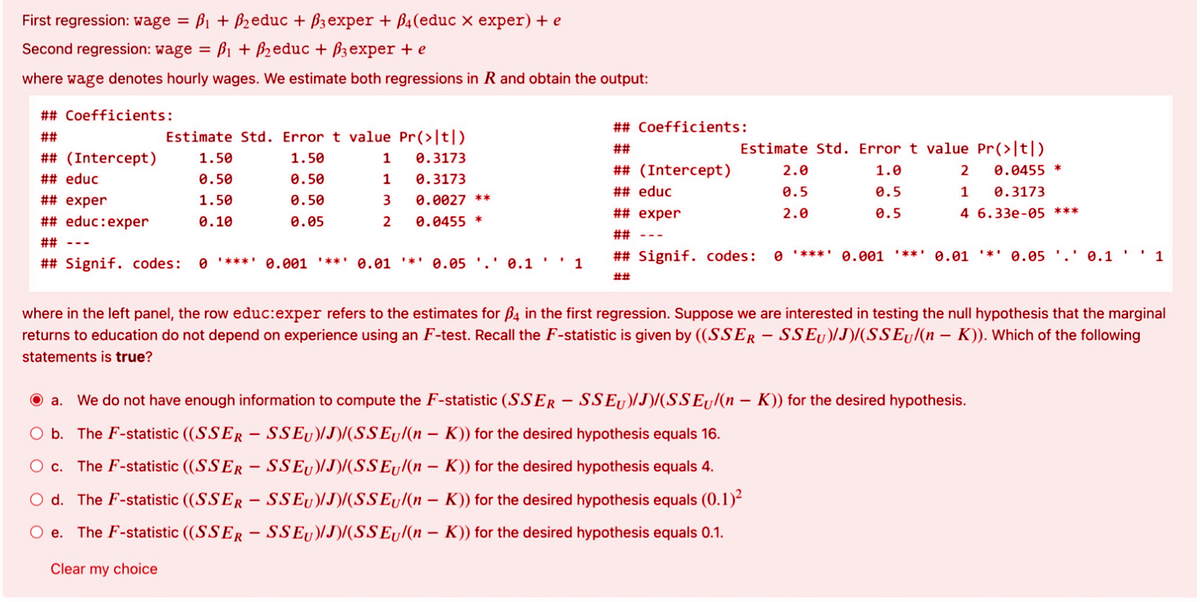
Transcribed Image Text:First regression: wage = B1 + B2educ + B3 exper + B4(educ x exper) + e
Second regression: wage = B1 + Bzeduc + B3exper + e
where wage denotes hourly wages. We estimate both regressions in R and obtain the output:
## Coefficients:
ETTI
## Coefficients:
##
Estimate Std. Error t value Pr(>|t|)
##
Estimate Std. Error t value Pr(>|t|)
## (Intercept)
1.50
1.50
0.3173
## (Intercept)
2.0
1.0
0.0455 *
## educ
0.50
0.50
1
0.3173
## educ
0.5
0.5
1
0.3173
## exper
1.50
0.50
0.0027 **
## exper
2.0
0.5
4 6.33e-05 ***
## educ:exper
0.10
0.05
0.0455 *
##
## ---
## Signif. codes: 0 '***' 0.001 '**' 0.01 '*' 0.05 '.' 0.1 '' 1
## Signif. codes:
O '***' 0.001 '**' 0.01 '*' 0.05 '.' 0.1 ' ' 1
where in the left panel, the row educ:exper refers to the estimates for B4 in the first regression. Suppose we are interested in testing the null hypothesis that the marginal
returns to education do not depend on experience using an F-test. Recall the F-statistic is given by ((SSER - SSE)/J)/(SSEu/(n – K)). Which of the following
statements is true?
O a. We do not have enough information to compute the F-statistic (SSER - SS EU)/J)/(SSEu/(n – K)) for the desired hypothesis.
O b. The F-statistic ((SSER - SSEU)/J)/(SS Ey/(n – K)) for the desired hypothesis equals 16.
O c. The F-statistic ((SSER – SS EU)/J)/(SSEy/(n – K)) for the desired hypothesis equals 4.
O d. The F-statistic ((SSER – SS Ey)/J)/(SSEy/(n – K)) for the desired hypothesis equals (0.1)²
O e. The F-statistic ((SSER – SSEU)/J)/(SSE/(n – K)) for the desired hypothesis equals 0.1.
Clear my choice
Expert Solution
This question has been solved!
Explore an expertly crafted, step-by-step solution for a thorough understanding of key concepts.

This is a popular solution!

Trending now
This is a popular solution!

Step by step
Solved in 2 steps

Knowledge Booster


Learn more about
Need a deep-dive on the concept behind this application? Look no further. Learn more about this topic, economics and related others by exploring similar questions and additional content below.Recommended textbooks for you
Managerial Economics: Applications, Strategies an…
Economics
ISBN:
9781305506381
Author:
James R. McGuigan, R. Charles Moyer, Frederick H.deB. Harris
Publisher:
Cengage Learning
Managerial Economics: Applications, Strategies an…
Economics
ISBN:
9781305506381
Author:
James R. McGuigan, R. Charles Moyer, Frederick H.deB. Harris
Publisher:
Cengage Learning