Following are summary statistics for two data sets, A and B. A B Minimum 0.066 -2.235 1st Quartile 1.42 5.27 Median 2.60 8.03 3rd Quartile 6.02 9.13 Maximum 10.08 10.51 Compute the interquartile ranges for both A and B. b. Do the summary statistics for A provide enough information to construct a boxplot? If so, construct the boxplot. If not, explain why. Do the summary statistics for B provide enough information to construct a boxplot? If so, construct the boxplot. If not, explain why. a. C.
Following are summary statistics for two data sets, A and B. A B Minimum 0.066 -2.235 1st Quartile 1.42 5.27 Median 2.60 8.03 3rd Quartile 6.02 9.13 Maximum 10.08 10.51 Compute the interquartile ranges for both A and B. b. Do the summary statistics for A provide enough information to construct a boxplot? If so, construct the boxplot. If not, explain why. Do the summary statistics for B provide enough information to construct a boxplot? If so, construct the boxplot. If not, explain why. a. C.

Glencoe Algebra 1, Student Edition, 9780079039897, 0079039898, 2018
18th Edition
ISBN:9780079039897
Author:Carter
Publisher:Carter
Chapter10: Statistics
Section10.4: Distributions Of Data
Problem 19PFA

Related questions
Question
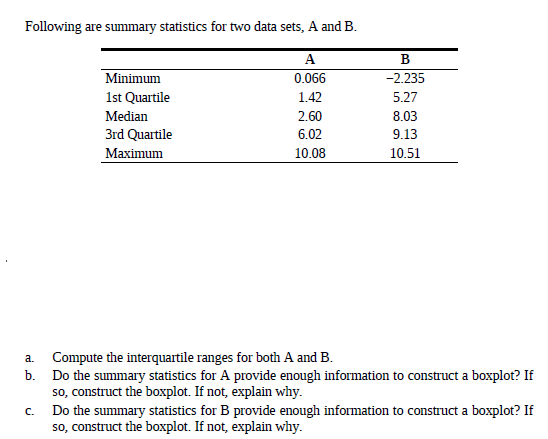
Transcribed Image Text:Following are summary statistics for two data sets, A and B.
A
B
Minimum
0.066
-2.235
1st Quartile
1.42
5.27
Median
2.60
8.03
3rd Quartile
6.02
9.13
Maximum
10.08
10.51
Compute the interquartile ranges for both A and B.
b. Do the summary statistics for A provide enough information to construct a boxplot? If
so, construct the boxplot. If not, explain why.
Do the summary statistics for B provide enough information to construct a boxplot? If
so, construct the boxplot. If not, explain why.
a.
C.
Expert Solution
This question has been solved!
Explore an expertly crafted, step-by-step solution for a thorough understanding of key concepts.

This is a popular solution!

Trending now
This is a popular solution!

Step by step
Solved in 5 steps with 5 images

Recommended textbooks for you
Glencoe Algebra 1, Student Edition, 9780079039897…
Algebra
ISBN:
9780079039897
Author:
Carter
Publisher:
McGraw Hill
Glencoe Algebra 1, Student Edition, 9780079039897…
Algebra
ISBN:
9780079039897
Author:
Carter
Publisher:
McGraw Hill