For each of the regions, use the midpoint method to identify whether the supply of this good is elastic or inelastic. Region Between V and W Between X and Y True Elastic True or False: As firms reach near maximum capacity at high levels of quantity supplied, supply becomes more elastic because firms may need to invest in additional capital in order to further increase production. False Inelastic
For each of the regions, use the midpoint method to identify whether the supply of this good is elastic or inelastic. Region Between V and W Between X and Y True Elastic True or False: As firms reach near maximum capacity at high levels of quantity supplied, supply becomes more elastic because firms may need to invest in additional capital in order to further increase production. False Inelastic

Principles of Economics 2e
2nd Edition
ISBN:9781947172364
Author:Steven A. Greenlaw; David Shapiro
Publisher:Steven A. Greenlaw; David Shapiro
Chapter5: Elasticity
Section: Chapter Questions
Problem 36P: The equation for a supply curve is P=3Q8. What is the elasticity in moving from a price of 4 to a...

Related questions
Question
15 to 20 min only
I need only correct answer with explanation
no
explanation is needed
Approach to solving the question:
***To solve for the elasticity of supply using the midpoint method, we use the formula;
Elasticity = [(Q2 - Q1)/{(Q2 + Q1)/2}] / [(P2 - P1)/{(P2 + P1)/2}]
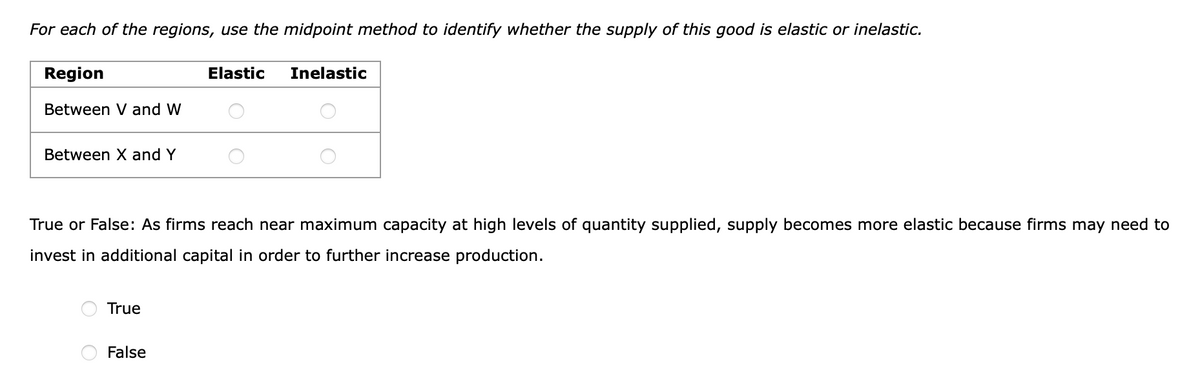
Transcribed Image Text:For each of the regions, use the midpoint method to identify whether the supply of this good is elastic or inelastic.
Region
Between V and W
Between X and Y
True
Elastic
True or False: As firms reach near maximum capacity at high levels of quantity supplied, supply becomes more elastic because firms may need to
invest in additional capital in order to further increase production.
False
Inelastic
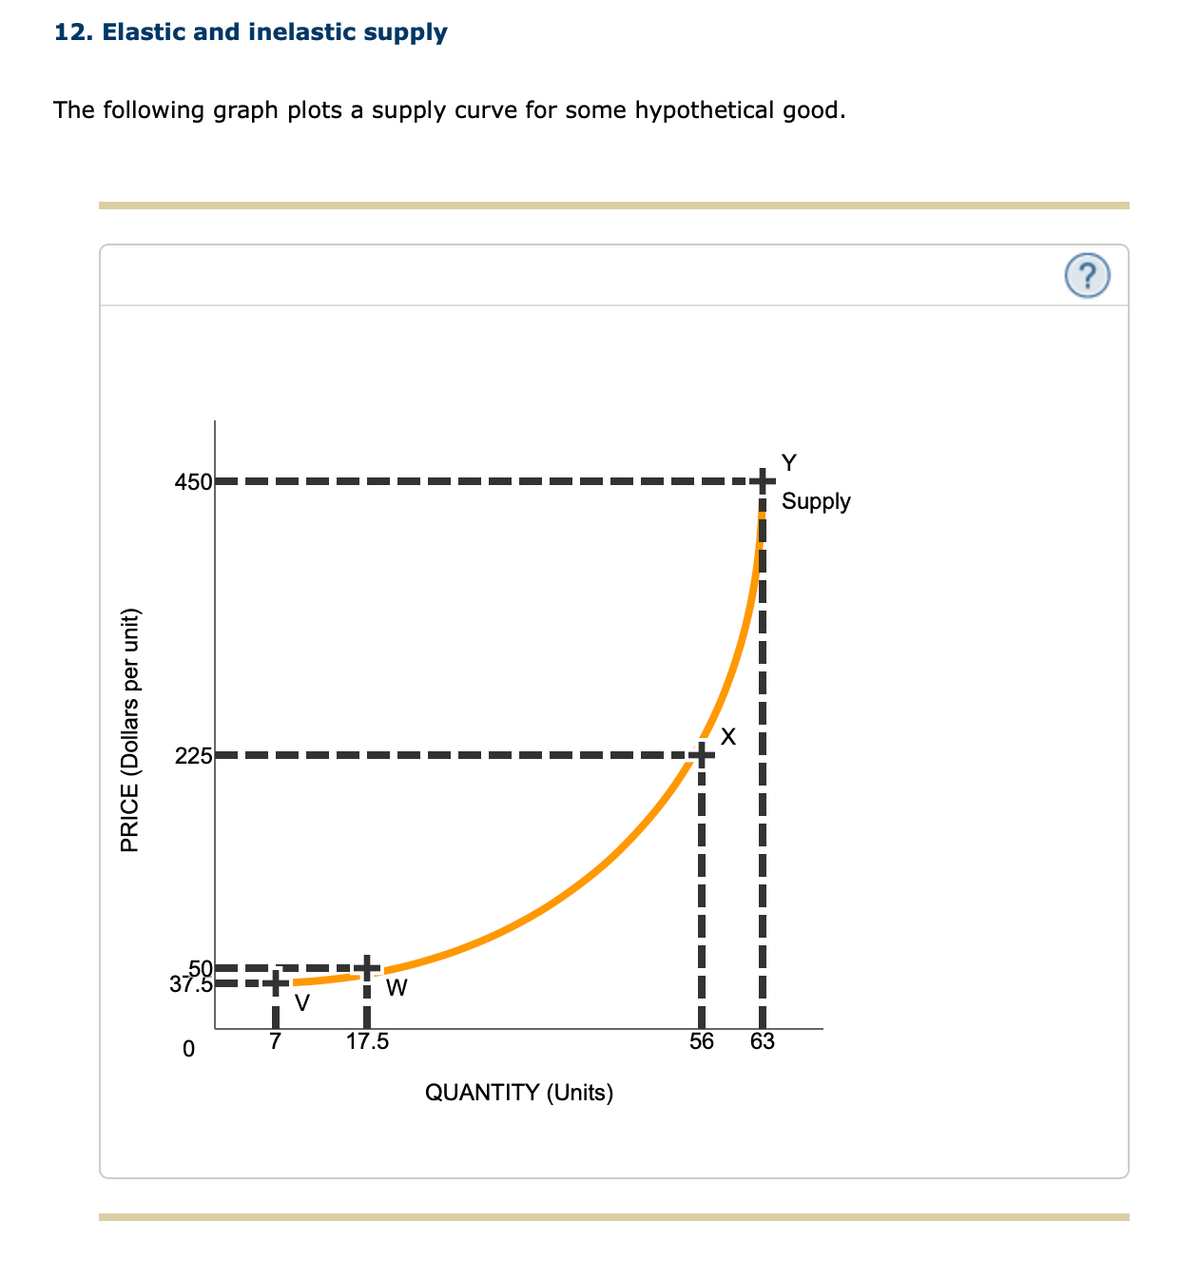
Transcribed Image Text:12. Elastic and inelastic supply
The following graph plots a supply curve for some hypothetical good.
PRICE (Dollars per unit)
450
225
37.9
O
W
17.5
QUANTITY (Units)
56 63
Y
Supply
?
Expert Solution
This question has been solved!
Explore an expertly crafted, step-by-step solution for a thorough understanding of key concepts.

This is a popular solution!

Trending now
This is a popular solution!

Step by step
Solved in 4 steps

Knowledge Booster


Learn more about
Need a deep-dive on the concept behind this application? Look no further. Learn more about this topic, economics and related others by exploring similar questions and additional content below.Recommended textbooks for you
Principles of Economics 2e
Economics
ISBN:
9781947172364
Author:
Steven A. Greenlaw; David Shapiro
Publisher:
OpenStax


Essentials of Economics (MindTap Course List)
Economics
ISBN:
9781337091992
Author:
N. Gregory Mankiw
Publisher:
Cengage Learning
Principles of Economics 2e
Economics
ISBN:
9781947172364
Author:
Steven A. Greenlaw; David Shapiro
Publisher:
OpenStax
Essentials of Economics (MindTap Course List)
Economics
ISBN:
9781337091992
Author:
N. Gregory Mankiw
Publisher:
Cengage Learning


