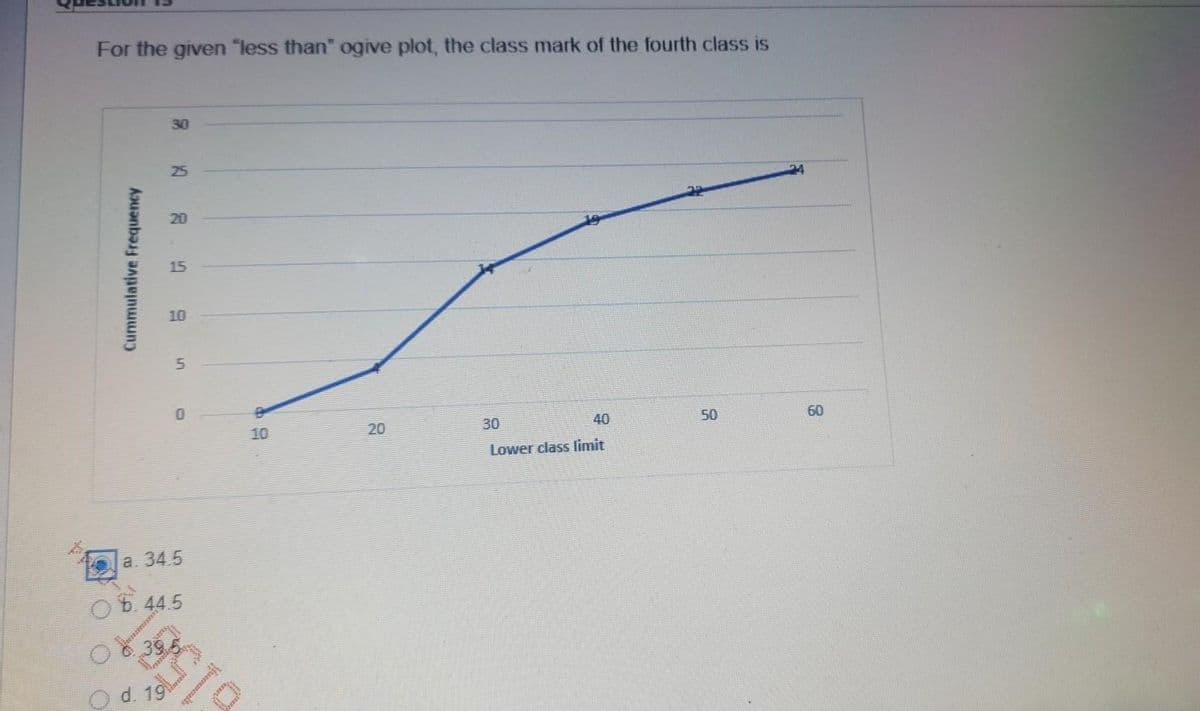
For the given "less than" ogive plot, the class mark of the fourth class is 30 25 20 19 15 10 20 30 40 50 60 10 Lower class limit а. 34.5 O 6.44.5 Cummulative Frequency 5.


Q: A statistics teacher plotted the Exam 1 and Exam 2 scores for her students. 100 80 40 20 40 50 60 70…
A: Given: Scatterplot of the exam 1 and exam 2 scores for her students. Does doing well on Exam 1 cause…
Q: 4. Consider the below data set: 65 87 x 75| 80 93 82 78 | 86 68 84 77 72 89 71 98 y 72 91 80 95 74…
A: Given: The data set: - x y 75 82 80 78 93 86 65 72 87 91 71 80 98 95 68 72 84…
Q: To investigate the relationship between yield of potatoes, y, and level of fertilizer application,…
A: Sxx is the sum of the square of the difference between x and mean of x.
Q: 1. The following data shows the number of colonies from 1950 to 2000. Year 1950 1960 1970 1980 1990…
A: Data visualization is the process of denoting the numerical data visually. Data visualization can be…
Q: (a) With x= representative age and y = median distance walked in 6 minutes, construct a scatterplot.…
A: As per our guidelines, we are allowed to answer first three sub-parts only of a question. Thanks…
Q: The following data shows the car rental companies and their cars and corresponding income in the…
A: From the given data The scatterplot is
Q: A driver records in the table her speed at various times during her journey. Time (min.) Speed (mph)…
A: Given that The scatter plot is created as Excel : data : insert : scatterplot The correct plot is…
Q: Fiber content (in grams per serving) and sugar content (in grams per serving) for nine high fiber…
A: Given : Fiber content (in grams per serving ) & sugar content (in grams per serving) for 9 fiber…
Q: The two data sets are dependent. Find d to the near est tenth. X 6.5 8.9 7.5 8.1 6.8 5.7 7) Y 9.1…
A: Solution: 7. From the given information, the data set is
Q: For the stem-and-leaf plot below, find the range of the data set. Leaf Unit = 1.0 1| 4 5 2| 6 6 6…
A: Given, 1| 4 52| 6 6 6 7 8 92| 7 7 7 8 8 9 9 93| 0 1 1 2 3 4 4 53| 6 6 6 7 8 8 9 The range is the…
Q: The table shows the populations y (in millions) of the United States for 2004 through 2009. The…
A: According to our company's guidelines I can only answer first three subparts of the question. For…
Q: Calculate Harmonic from the following statistical data : Wages: 10 12 14 16 18 No. of workers: 2 5 8…
A:
Q: Assume that the differences are normally distributed. Complete parts (a) through (d) below.…
A: Given : X Y 42.4 46.3 47 47.4 52.9 54.5 48.5 53.1 51 53.3 49.1 50.8 54.3 54.9…
Q: Here is a data set: 10 30 49 20 12 14 23 14 29 32 20 23 20 29 23 19 33 14 36 21 25 26 18 17 47 27 24…
A: Here given data set is 10 30 49 20 12 14 23 14 29 32 20 23 20 29 23 19 33 14 36 21 25 26…
Q: To investigate the relationship between yield of potatoes, y, and level of fertilizer application,…
A:
Q: table shows the populations y (in millions) of the United States for 2009 through 2014. The variable…
A:
Q: Use the dot plot to ans wer the questians Brown Green Yettow Crangeo Blue Red What percentage of…
A: The total number of dots are, Red+Blue+green+yellow+orange+brown=9+7+5+3+2+1=27
Q: Let x be the average number of employees in a group health insurance plan, and let y be the average…
A:
Q: For the data set below, use the graph to determine if 2. 3. 9.1 16.2 35.4 77.2 94 4 AYIS…
A: Given data set is
Q: A listing of calories per one ounce of selected salad dressings (not fat-free) is given below. 160…
A: The stem plot is constructed by taking hundredth and tenth places as stem and one’s place as leaves…
Q: The following data were obtained in a study of the relationship between the weight and chest size of…
A: a) Note that X represents chest size and Y represents weight.
Q: Mars, Inc. states that 16% of all milk chocolate M&M’S® produced are green. A group of students took…
A: 1)Given20 samples of M&Ms with sample size 3020 samples of M&Ms with sample size 60. To…
Q: The table gives the percentage of persons in the United States under the age of 65 whose health…
A: Given that a table gives the percentage of persons in the United States under the age of 65 whose…
Q: A sample of 10 people ingested a new formulation of a new drug. Six hours later, the concentrations…
A: Dot plot:It is a variation in bar chart in which dots are used instead of bars to represent the…
Q: Assume that the differences are normally distributed. Complete parts (a) through (d) below.…
A: The values of the d are –1.8, –0.7, –2.1, –3.9, –1.2, –2.4, –3.3, 0.8.
Q: The box plots show the target heart rates of men 20-40 years old and men 50-70 years old. Target…
A: The Statement A is false
Q: Answer the following questions given the parallel box plots. Which grade has the largest IQR? HGrade…
A: Given box plot for grade 10 and 11 is
Q: Applying the method of group of averages, find a curve of the form y = ax +b _to the following data:…
A: We are given the curve : y=ax2+b According the question, when x=1 , then y=0.43…
Q: Find average in classified data set (k=4) Sınıflandırılmış verilerde ortalamayı bulunuz (k=4) 6 - 17…
A: Given data is appropriate for mean of a series is the figure obtained by dividing the total values…
Q: Consider the below data set: x 75 80 93 65 87 71 98 68 84 77 y 82 78 86 72 91 80 95 72 89 74 (a)…
A: we have given the data x 75 80 93 65 87 71 98 68 84 77 y 82 78 86 72 91 80 95 72 89 74 To…
Q: 2. A researcher measures the relationship between education (in years) and investment gains (in…
A: Dear students as per the guidelines we solve first three subparts only when multiple subparts are…
Q: Assume that the differences are normally distributed. Complete parts (a) through (d) below.…
A: We have given the values of X and Y. We have to find difference, di=Xi-Yi for each pair of data. We…
Q: A researcher measures the relationship between education (in years) and investment gains (in…
A: a. The scatter plot with the line of best fit can be obtained using EXCEL software. Enter the…
Q: Assume that the differences are normally distributed. Complete parts (a) through (d) below.…
A: The following table gives the differences.
Q: Q.3. The annual precipitation data (mm) recorded at Kumköy, Istanbul in period 1952-1990 are given…
A: Hello. Since your question has multiple sub-parts, we will solve first three sub-parts for you. If…
Q: Q.3. The annual precipitation data (mm) recorded at Kumköy, Istanbul in period 1952-1990 are given…
A: Since you have posted a question with multiple sub-parts, we will solve first three subparts for…
Q: The following scatter plot has a linear relationship. O True O False
A: Explanation of the answer is as follows
Q: True or False: Given below is the scatter plot of the price/earnings ratio versus eamings per share…
A:
Q: Consider the following box and whiskers plot to fill the table below: 0 1 2 3 4 5 6 7 8 9 10 11 12…
A: The box and whisker plot displays the five number summary: 1). Minimum value 2). First quartile (Q1)…
Q: Applying the method of group of averages, find a curve of the form y= ax +b to the following data:…
A: We will answer the first question as we don't answer multiple question at a time. Please resubmit…
Q: To investigate the relationship between yield of potatoes, y, and level of fertilizer application,…
A:
Q: study is made of the relationship between annual production volume of Good A and factory floor area.…
A:
Q: Which conclusion can be drawn from the dot plots below with regard to the number of hours spent on…
A:
Q: For the given data set: 8. 12 11 19 y 10 7 15 6. 13 Part 1 of 6 Draw a scatter plot. IS- 14- 12- 10…
A: Scatter Plot: A scatterplot is a graphical way to display the relationship between two sample…
Q: The following table lists the calories per 100 milliliters of 25 popular beers. Construct a…
A: Arrange the given data in ascending order26, 32 , 36, 36 , 37 , 39, 39, 40, 40, 41, 42, 42,43, 45,…
Q: Assume that the differences are normally distributed. Complete parts (a) through (d) below.…
A: The sample size is given as n = 8.
Q: • Given the following data in the table:- 1- Draw the curve where Y is vertical axis and X is…
A: Scatterplot is plotting the data points on x and y axis. It is the graphical representation of data…
Q: t. %24 %23 Product Price, [$] Consider the following data set that contains information about the…
A: Given, Gas price per gallon ( X ) Price of a dozen eggs ( Y ) 2.3 0.98 2.45 1.16 2.64…
Q: The following is a table of the ages, in months, (X) of 7 infants and the number of hours (Y) each…
A: Given the table of the ages, in months, (X) of 7 infants and the number of hours (Y) each slept in a…
Q: An article in Wear (1992, Vol. 152, pp. 171-181) presents data on the fretting wear of mild steel…
A: Answer : The complete solution is given below in the attachment file.

Step by step
Solved in 2 steps

- An instructor wants to compare the performance on a test between her 1st period students and her 2nd period students. Below is the box plots for each period. Which of the following statements below is correct?a. What percentage of people in this survey spent an average of between the first quartileand the third quartile?b. The first quartile is 4 the third quartile is 15, calculate the upper inner fence and the lowerinner fence? c. What would be the direction of skewness based on this boxplot? d. How many outliers are there in this plot?The following data shows the measured distance between A and B. Determine the Most probable distance between A and B.
- Consider the following ordered data.2 5 5 6 7 7 8 9 10 Find the low, Q1, median, Q3, and high. b) Find the interquartile range c) Make a box-and-whisker plotFor making a scatter plot of the data set, which would be the best scale and interval for the axis that represents the amount of fluoride?For the reference see the attached table for are under normal curve. Answer the followinf with complter solution
- Consider the following ordered data. 2 5 5 6 7 7 8 9 10 (a) Find the low, Q1, median, Q3, and high. low Q1 median Q3 high (b) Find the interquartile range.(c) Make a box-and-whisker plot.A random sample of ten professional athletes produced the following data where xis the number of endorsements the player has and y is the amount of money made (in millions of dollars). Draw a scatter plot of the data. x; 0 3 2 1 5 5 4 3 0 4 y; 2 8 7 3 13 12 9 9 3 10Below are graphical representations of two different samples, with the sample size indicated, from two different populations. For which of the two samples would it be safe to construct a t-interval? A) Sample A only B) Sample B only C) Samples A and B D) None of the samples E) Not enough information is given.
- A pediatrician wants to determine the relation that exists between a child's height, x, and head circumference, y. She randomly selects 11 children from her practice, measures their heights and head circumferences, and obtains the accompanying data. Complete parts (a) through (g) below.Please, find the Geomatric Mean of the given data. ASAP Monthly rent less than (Rs.) 10 20 30 40 50 60 70 80 Number of families 03 08 16 26 37 50 56 60HELP ME ANSWER THIS & Interpret the resulting measures by giving impressions for the single values.

