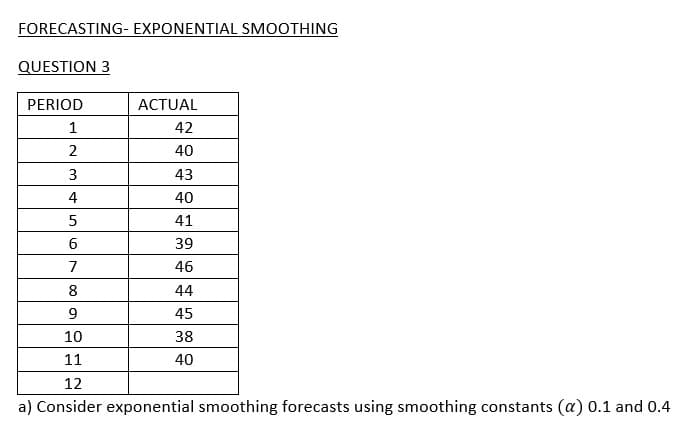
FORECASTING- EXPONENTIAL SMOOTHING QUESTION 3 PERIOD ACTUAL 1 42 40 3 43 4 40 41 39 7 46 8 44 9. 45 10 38 11 40 12 a) Consider exponential smoothing forecasts using smoothing constants (a) 0.1 and 0.4


Q: The company Handy Inc. produces a solar-powered electronic calculator that has experienced the…
A: 1) From the data given :-a) Moving average with N=3 forecast is given as :- Ft=Dt-1+Dt-2+Dt-33…
Q: he formula of exponential smoothing method of forecastin
A: Exponential smoothing is a time series forecasting method for univariate data. Exponential smoothing…
Q: Week Passengers 440 11 446 12 451 13 455 14 464 15 996 474 17 476 18 482 a. Explain why an averaging…
A: After observing the data, we can see that there is an upward increasing trend. In case the average…
Q: Choose the type of forecasting technique (survey, Delphi, averaging, seasonal, naive, trend,…
A: Delphi Technique of forecasting would be appropriate to predict the demand for vacations on the…
Q: It has been said that forecasting using exponential smoothing is like driving a car by looking in…
A: A person drives a car, he knows where he has to look. In most of the time, he has to look straight…
Q: Choose the type of forecasting technique (survey, Delphi, averaging, seasonal, naive, trend,…
A: The types of forecasting technique (survey, Delphi, averaging, seasonal, naive, trend,…
Q: Solve the following: 1. Sales of Volkwagen’s popular Beetle have grown steadily at auto dealership…
A: Formula used to calculate the Forecast for years 2 to 6 = Forecast of previous year + α(Previous…
Q: Exponential Smoothing Forecasting Use the area below to draw a line chart for single exponential…
A: Exponential Smoothing Forecasting Ft+1 = At-1×α+1-αFt Error = Actual data -Forecast data Mean…
Q: 10. What is the approximate forecast for May using a four-month moving average? a.38 b.43 c.44 d. 47
A: Given data is
Q: 2. The department manager using a combination of methods has forecast sales of toasters at a local…
A: Below is the solution:-
Q: What advantages does exponential smoothing have over movingcaverages as a forecasting tool?
A: The following are the benefits of exponential smoothing as a forecasting tool over moving averages.…
Q: A check-processing center uses exponential smoothing to forecast the number of incoming checks each…
A: Given Forecast S(June) = 42 million Checks in June X(June) = 40 million Smoothing constant α=0.2
Q: An analyst must decide between two different forecasting techniques for weekly sales of roller…
A: Given data-
Q: for the 8th week using weights of 3, 2, and 1 (where the most recent week receives the highest…
A: THE ANSWER IS AS BELOW:
Q: Exponential smoothing is used to forecast automobile battery sales. Two value of a are examined, a =…
A: Given information:
Q: The number of fishing rods selling each day is given below. Perform analyses of the time series to…
A: Note: - Since we can answer up to three subparts, we will answer the first three subparts here. If…
Q: ABC Bank is thinking of opening a new branch in a certain city besides its existing branches due to…
A: Banking operation includes the practice of the bank deposit, loan ensuring the transaction of the…
Q: Period Actual 1 12 2 15 16 4 16 Given the information in the following table, Use exponential…
A: Note: - Since the actual data for period 5 is not given, the trend-adjusted forecast can be made by…
Q: What th ree methods are used to determine the accuracy of any given forecasting method? How would…
A:
Q: Develop a 3-weck weighted average forecast for Week 4 through 9 with weights WI - W2 = W3 = 0.2 0.3…
A: A moving average based on weighted average puts weight on the data gathered recently, by multiplying…
Q: a) Forecast the demand for the week of October 12 using a 3-week moving average. b) Use a 3-week…
A: Forecasting is the process of estimating the future demand according to previous or historic…
Q: i. What are the 3-months moving average forecasts for months 4, 5, 6 & 7? ii. What are the 3-month…
A: Forecasting is estimated predictions for the present as well as for the future as per the past data.…
Q: Consider the data below which includes sales data and the forecasts that would have been made using…
A: Given data is
Q: XYZ Chips Inc. (XCI) produces Centrino-type chips. The market has been inclining with ups and downs…
A: Forecasting Technique we are using here is Moving average forecasting Technique: A moving average is…
Q: Accuracy of forecasts. The manager of a large manufacturer of industrial pumps must choose…
A: Given data, Assume that each forecast has an average error of zero. Forecast Month…
Q: a. Plot the monthly data b. Forecast September sales using: i. A linear trend equation ii. A…
A: THE ANSWER IS AS BELOW:
Q: The company's sales history (in thousands of units) is shown in the table below. Use exponential…
A: Concept and formulas used: FIT = Forcast Including Trend FIT = Ft + Tt Ft = FITt-1 + a…
Q: 12-1. The Hartley-Davis motorcycle dealer in the Minneapolis- St. Paul area wants to be able to…
A: Given - Month Sales January 9 February 7 March 10 April 8 May 7 June 12 July 10…
Q: Describe three different forecasting applications at Hard Rock.Name three other areas in which you…
A: Introduction: Hard Rock Cafe is a restaurant chain which is founded in the year 1971 in London and…
Q: Marianne Schwartz, the owner of Handy Man Rentals, rents carpet cleaners to contractors and walk-in…
A:
Q: Figure out the better forecasting technique among 2 periods Moving Average, Naive technique, and…
A: The forecasting technique can be determined as follows:
Q: Justify the trade-off between responsiveness and consistency in a time-series forecasting system.
A: TradeoffTradeoff is a situational decision taken approach, that involves diminishing quality,…
Q: Choose the type of forecasting technique (survey, Delphi, averaging, seasonal, naive, trend,…
A: Seasonal forecast is a type where the prediction is done only in that particular season. This is…
Q: 3. The weekly demand for units manufactured by the Orion Company Limited has been as follows: Week 1…
A: Formula:
Q: pply the moving average with base m=4 forecasting technique of the data to estimate the demand in…
A: With a moving average of 4, the demand of the product is basically an average of the demand of last…
Q: A recently introduced product has a positive trend in sales. The product’s sales have increased in…
A: Adjusted exponential smoothing forecasting model This is a sort of exponential…
Q: What forecasting technique makes use of written surveys or telephone interviews? Historical…
A: We’ll answer the first question since the exact one wasn’t specified. Please submit a new question…
Q: 13. Two forecasting methods have been used to evaluate the same economic time series. The results…
A: Formula:
Q: Consider the following time series data. Choose the correct time series plot. (i) (ii)…
A: A time series is a grouping of information focuses that happen in progressive requests throughout…
Q: The following data shows sales forecast of Axis Dealer for motorbikes. Month Demand 1 650 2 700 810…
A: Given data:
Q: F1 = F, + a(D, – F,) MA3 = (D1+D2+D3)/3 1+1 Week Calls МАЗ ES Squared Errors with MA3 Squared Errors…
A: 1) The 3-period moving average forecast can be determined in excel as follows: Thus, the forecast…
Q: 9 438 18 482 a. Explain why an averaging technique would not be appropriate for forecasting. b. Use…
A: Forecasting is an important part of any business. It helps to predict future demand and production…
Q: If the demand in the current week was 102 units and we had forecast it to be 125, what would be next…
A: Exponential smoothing is a time series forecasting technique that forecasts data for a given period…
Q: October 5 a) Forecast the demand for the week of October 12 using a 3-week moving average. b) Use a…
A:
Q: b) Use a 3-week weighted moving average, with weights of.1, .3, and .6, using.6 for the most recent…
A: Forecasting is the process of determining the estimated future demand using historical information…
Q: In the text, the example of Walmart's collaboration with Sara Lee during hurricane season enables…
A: Demand forecasting is the method involved with utilizing prescient investigation of verifiable…
Q: Explain the advantages of forecasting tool does exponential smoothing over moving avarages ?
A: The key benefits of exponential smoothing versus moving averages as a forecast.
Q: Justify exponential smoothing's superiority to moving averages as a forecasting method
A: In today's climate, at which events keep changing, the quantile approach is superior.
Q: b) The forecast for the next month (Jan) using the naive method= 22 sales (round your response to a…
A: Forecasting is the process of predicting future events or trends based on past and present data.…


Trending now
This is a popular solution!

Step by step
Solved in 2 steps with 2 images

- The file P13_42.xlsx contains monthly data on consumer revolving credit (in millions of dollars) through credit unions. a. Use these data to forecast consumer revolving credit through credit unions for the next 12 months. Do it in two ways. First, fit an exponential trend to the series. Second, use Holts method with optimized smoothing constants. b. Which of these two methods appears to provide the best forecasts? Answer by comparing their MAPE values.The Baker Company wants to develop a budget to predict how overhead costs vary with activity levels. Management is trying to decide whether direct labor hours (DLH) or units produced is the better measure of activity for the firm. Monthly data for the preceding 24 months appear in the file P13_40.xlsx. Use regression analysis to determine which measure, DLH or Units (or both), should be used for the budget. How would the regression equation be used to obtain the budget for the firms overhead costs?The owner of a restaurant in Bloomington, Indiana, has recorded sales data for the past 19 years. He has also recorded data on potentially relevant variables. The data are listed in the file P13_17.xlsx. a. Estimate a simple regression equation involving annual sales (the dependent variable) and the size of the population residing within 10 miles of the restaurant (the explanatory variable). Interpret R-square for this regression. b. Add another explanatory variableannual advertising expendituresto the regression equation in part a. Estimate and interpret this expanded equation. How does the R-square value for this multiple regression equation compare to that of the simple regression equation estimated in part a? Explain any difference between the two R-square values. How can you use the adjusted R-squares for a comparison of the two equations? c. Add one more explanatory variable to the multiple regression equation estimated in part b. In particular, estimate and interpret the coefficients of a multiple regression equation that includes the previous years advertising expenditure. How does the inclusion of this third explanatory variable affect the R-square, compared to the corresponding values for the equation of part b? Explain any changes in this value. What does the adjusted R-square for the new equation tell you?
- The file P13_29.xlsx contains monthly time series data for total U.S. retail sales of building materials (which includes retail sales of building materials, hardware and garden supply stores, and mobile home dealers). a. Is seasonality present in these data? If so, characterize the seasonality pattern. b. Use Winters method to forecast this series with smoothing constants = = 0.1 and = 0.3. Does the forecast series seem to track the seasonal pattern well? What are your forecasts for the next 12 months?The file P13_26.xlsx contains the monthly number of airline tickets sold by the CareFree Travel Agency. a. Create a time series chart of the data. Based on what you see, which of the exponential smoothing models do you think will provide the best forecasting model? Why? b. Use simple exponential smoothing to forecast these data, using a smoothing constant of 0.1. c. Repeat part b, but search for the smoothing constant that makes RMSE as small as possible. Does it make much of an improvement over the model in part b?The file P13_28.xlsx contains monthly retail sales of U.S. liquor stores. a. Is seasonality present in these data? If so, characterize the seasonality pattern. b. Use Winters method to forecast this series with smoothing constants = = 0.1 and = 0.3. Does the forecast series seem to track the seasonal pattern well? What are your forecasts for the next 12 months?
- The file P13_22.xlsx contains total monthly U.S. retail sales data. While holding out the final six months of observations for validation purposes, use the method of moving averages with a carefully chosen span to forecast U.S. retail sales in the next year. Comment on the performance of your model. What makes this time series more challenging to forecast?The file P13_02.xlsx contains five years of monthly data on sales (number of units sold) for a particular company. The company suspects that except for random noise, its sales are growing by a constant percentage each month and will continue to do so for at least the near future. a. Explain briefly whether the plot of the series visually supports the companys suspicion. b. By what percentage are sales increasing each month? c. What is the MAPE for the forecast model in part b? In words, what does it measure? Considering its magnitude, does the model seem to be doing a good job? d. In words, how does the model make forecasts for future months? Specifically, given the forecast value for the last month in the data set, what simple arithmetic could you use to obtain forecasts for the next few months?Do the sales prices of houses in a given community vary systematically with their sizes (as measured in square feet)? Answer this question by estimating a simple regression equation where the sales price of the house is the dependent variable, and the size of the house is the explanatory variable. Use the sample data given in P13_06.xlsx. Interpret your estimated equation, the associated R-square value, and the associated standard error of estimate.
- The file P13_25.xlsx contains the quarterly numbers of applications for home mortgage loans at a branch office of Northern Central Bank. a. Create a time series chart of the data. Based on what you see, which of the exponential smoothing models do you think will provide the best forecasting model? Why? b. Use simple exponential smoothing to forecast these data, using a smoothing constant of 0.1. c. Repeat part b, but search for the smoothing constant that makes RMSE as small as possible. Does it make much of an improvement over the model in part b? Is it guaranteed to produce better forecasts for the future?A small computer chip manufacturer wants to forecast monthly ozperating costs as a function of the number of units produced during a month. The company has collected the 16 months of data in the file P13_34.xlsx. a. Determine an equation that can be used to predict monthly production costs from units produced. Are there any outliers? b. How could the regression line obtained in part a be used to determine whether the company was efficient or inefficient during any particular month?Under what conditions might a firm use multiple forecasting methods?

