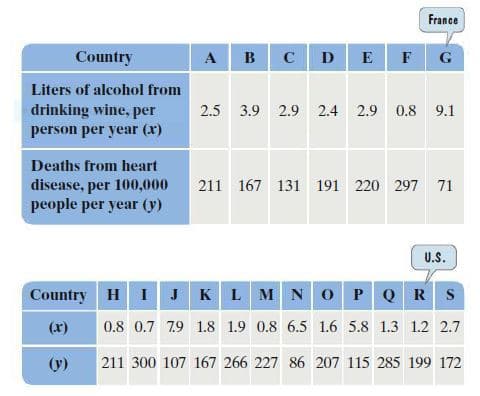
France Country A B D E F G Liters of alcohol from drinking wine, per person per year (x) 2.5 3.9 2.9 2.4 2.9 0.8 9.1 Deaths from heart disease, per 100,000 people per year (y) 211 167 131 191 220 297 71 U.S. Country H IJ KLMNO PQRS (x) 0.8 0.7 7.9 1.8 1.9 0.8 6.5 1.6 5.8 1.3 1.2 2.7 | (y) 211 300 107 167 266 227 86 207 115 285 199 172


Correlation
Correlation defines a relationship between two independent variables. It tells the degree to which variables move in relation to each other. When two sets of data are related to each other, there is a correlation between them.
Linear Correlation
A correlation is used to determine the relationships between numerical and categorical variables. In other words, it is an indicator of how things are connected to one another. The correlation analysis is the study of how variables are related.
Regression Analysis
Regression analysis is a statistical method in which it estimates the relationship between a dependent variable and one or more independent variable. In simple terms dependent variable is called as outcome variable and independent variable is called as predictors. Regression analysis is one of the methods to find the trends in data. The independent variable used in Regression analysis is named Predictor variable. It offers data of an associated dependent variable regarding a particular outcome.
Is there a relationship between wine consumption and deaths from heart disease? The table gives data from 19 developed countries.
a. Use the statistical menu of your graphing utility to enter the 19 ordered pairs of data items shown in the table.
b. Use the scatter plot capability to draw a scatter plot of the data.
c. Select the linear regression option. Use your utility to obtain values for a and b for the equation of the regression line, y = ax + b.
d.Use the appropriate sequence to graph the regression equation on top of the points in the scatter plot.


Trending now
This is a popular solution!

Step by step
Solved in 3 steps with 2 images


