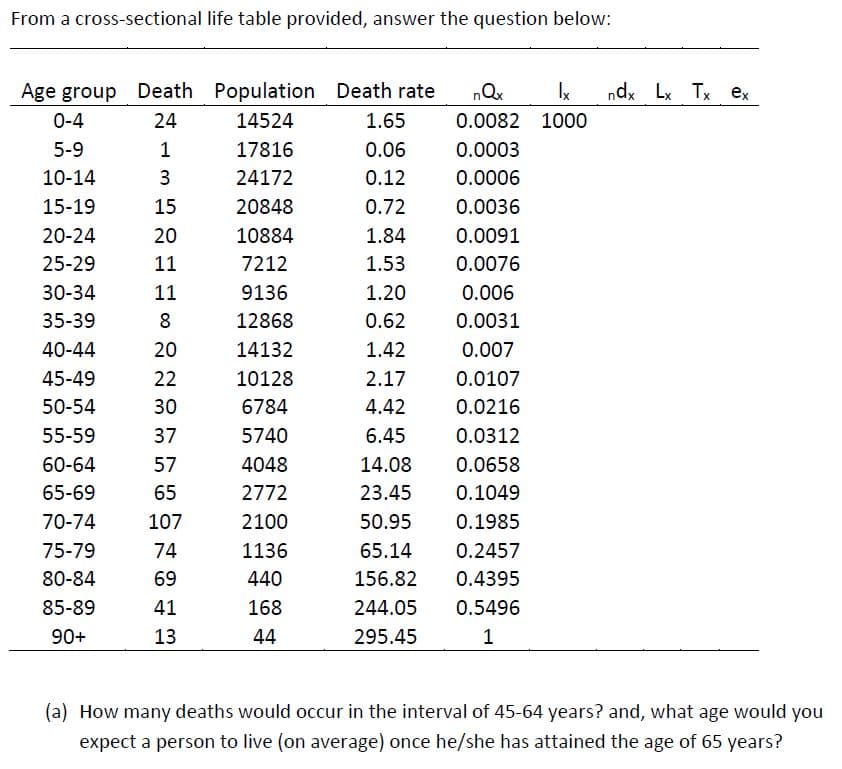
From a cross-sectional life table provided, answer the question below: Age group Death Population Death rate nQx ndx Lx Tx ex 0-4 24 14524 1.65 0.0082 1000 5-9 1 17816 0.06 0.0003 10-14 24172 0.12 0.0006 15-19 15 20848 0.72 0.0036 20-24 20 10884 1.84 0.0091 25-29 11 7212 1.53 0.0076 30-34 11 9136 1.20 0.006 35-39 8 12868 0.62 0.0031 40-44 20 14132 1.42 0.007 45-49 22 10128 2.17 0.0107 50-54 30 6784 4.42 0.0216 55-59 37 5740 6.45 0.0312 60-64 57 4048 14.08 0.0658 65-69 65 2772 23.45 0.1049 70-74 107 2100 50.95 0.1985 75-79 74 1136 65.14 0.2457 80-84 69 440 156.82 0.4395 85-89 41 168 244.05 0.5496 90+ 13 44 295.45 1 (a) How many deaths would occur in the interval of 45-64 years? and, what age would you expect a person to live (on average) once he/she has attained the age of 65 years? 3.


Optimization
Optimization comes from the same root as "optimal". "Optimal" means the highest. When you do the optimization process, that is when you are "making it best" to maximize everything and to achieve optimal results, a set of parameters is the base for the selection of the best element for a given system.
Integration
Integration means to sum the things. In mathematics, it is the branch of Calculus which is used to find the area under the curve. The operation subtraction is the inverse of addition, division is the inverse of multiplication. In the same way, integration and differentiation are inverse operators. Differential equations give a relation between a function and its derivative.
Application of Integration
In mathematics, the process of integration is used to compute complex area related problems. With the application of integration, solving area related problems, whether they are a curve, or a curve between lines, can be done easily.
Volume
In mathematics, we describe the term volume as a quantity that can express the total space that an object occupies at any point in time. Usually, volumes can only be calculated for 3-dimensional objects. By 3-dimensional or 3D objects, we mean objects that have length, breadth, and height (or depth).
Area
Area refers to the amount of space a figure encloses and the number of square units that cover a shape. It is two-dimensional and is measured in square units.
From a cross-sectional life table provided, answer the question below:


Trending now
This is a popular solution!

Step by step
Solved in 4 steps with 1 images


