From a cross-sectional life table provided, please answer the following c Age group Death Population Death rate nQx Ix nC 0-4 24 14524 1.65 0.0082 1000 5-9 1 17816 0.06 0.0003 10-14 3 24172 0.12 0.0006 15-19 15 20848 0.72 0.0036 20-24 20 10884 1.84 0.0091 25-29 11 7212 1.53 0.0076 30-34 11 9136 1.20 0.006 35-39 8 12868 0.62 0.0031 40-44 20 14132 1.42 0 007
Q: The economic dynamism, which is the index of productive growth (in dollars) for countries that are…
A: vii) For the given sample, Sample mean=43.8727, excel function, =AVERAGE(J1:J26) Sample standard…
Q: From the information given below find Laspeyres' and Paasche's price index number for year Il with…
A:
Q: Consider the following model that relates the percentage of a household’s budget spent on milk MK to…
A: ?2 = 2.7648 This implies that a unit increase in the corresponding independent variable leads to an…
Q: Listed below, along with some summary statistics, are amounts of strontium-90 (in millibecquerels…
A: The data is collected from the same group of subjects consecutively for two years. Therefore both…
Q: The data shown in Table 1 are the average petrol consumption of sedan cars in kilometre per litre…
A: Given a data set, we have to construct stem and leaf plot of the data set.
Q: Consumption of monthly electric power in million of kwh for street lighting in a big city during…
A:
Q: 7. Compute the crude and ständardised death rates of the two populations A and B from the following…
A:
Q: In which of the following years (see attached below) did the number of graduate student applications…
A: To find the year when the graduate student applications increase the most from that of the previous…
Q: Table 1 displays the measurements of drying time, in hours, of a certain brand of latex paint. Table…
A: Using the given data Answer the given questions
Q: Below are data from a survey on number of times students go to ABC Mall per month: Number of…
A: Number of Visits to Mayfair Mall Frequency Proportion Percentage Cumulative Percentage 0 10 0.0917…
Q: The economic dynamism, which is the index of productive growth (in dollars) for countries that are…
A: Hello! As you have posted more than 3 sub parts, we are answering the first 3 sub-parts. In case…
Q: In 1998 El Salvador had a gini index of 54.50 and 26 years later had a gini index of 38.
A:
Q: The following information is on food items for the years 2010 and 2018. 2010 2018 Item Price…
A:
Q: Consider this data set of (n 117) birth weights in grams that has been sorted. 1483 1693 1868 1951…
A: 85 percentile:-Pi=i(n+1)100th term
Q: eBook A sample containing years to maturity and yield for 40 corporate bonds are contained in the…
A: Hello! As you have posted more than 3 sub parts, we are answering the first 3 sub-parts. In case…
Q: From a cross-sectional life table provided, answer the question below: Age group Death Population…
A: Life tables are used to project future population on the basis of the present death rate.…
Q: A famous Chinese restaurant would like to find out the change in demand on its dim-sum. After…
A:
Q: From the data given below, calculate the gross and net reproduc- tion rates : Female Female…
A:
Q: Consider the following release data for a drug in water Q (Cumulative amount released in mg/cm²)…
A: The regression equation are Q = 11.8 + 0.121×TimeQ = 0.061 + 2.96×Time
Q: Calculate the semi-interquartile range and quartile coefficient from the following : Age in years…
A:
Q: 2. Using the select life table provided at the beginning of the paper, calculate 4|2977]+1 You will…
A: From the given life table , we have to calculate : 42 q77+1
Q: Given the data in Table 2 for Suriname, calculate the following measures for the period 1973-1980.…
A: As per the Bartleby guildlines we have to solve first three subparts and rest can be reposted...…
Q: The following data have been collected on the number of times that owner-occupied and…
A:
Q: The economic dynamism, which is the index of productive growth (in dollars) for countries that are…
A: From the provided information, Sample size (n) = 26 Level of significance (α) = 0.05
Q: From the data given below calculate the gross reproduction rate assuming that the ratio of female…
A: Answer:
Q: Compute the crude and standardised death rates of the two populations A and B from the following…
A:
Q: Table 2.3. Absolute Frequency of Apis mellifera house bees across months Class Age Months (days)…
A: We have given absolute Frequency data : We have to calculate mean for every month and relative…
Q: Volcano Eruption Data Approximate Number of Eruptions Since 2200 B.C. (unless otherwise indicated)…
A: The data is mainly classified into 2, primary data and secondary data. Primary data is the data that…
Q: You are given the following mortality table: 74 0.015 75 0.018 76 0.021 77 0.027 78 0.032 79 0.036…
A: Given the mortality table as x qx 74 0.015 75 0.018 76 0.021 77 0.027 78 0.032 79…
Q: The data given below show the lives of 50 similar car batteries record d to the nearest tenth of a…
A:
Q: Out of the following data sets, which is best described as having a positive exponential…
A: The scatter plot of option a) is The scatter plot of option b) is
Q: 2. Consider the following data representing the life in hours of incandescent bulbs. 1,067 919 1,196…
A: Since you posted a question with multiple subparts, we will solve first three subparts for you. To…
Q: Complete the following table to compare men and women using data collected at the first examination…
A: Given:
Q: Approximate the mean for following GFDT. Data Frequency 70-74 1 75 - 79 4 80 - 84 85-89 11 90-94 24…
A:
Q: Compute the crude and standardized death rate! tions A and B from the following data : Age-group…
A: Answer:
Q: The following data show the caries experience of 7527 children 12-14 years old in 21 comrnunities…
A: Since you have posted a question with multiple sub-parts, we will solve first three sub- parts for…
Q: Calculate Crude death rate and Age-specific death rates for the following data Age group Population…
A:
Q: Assume mortality follows the following life table with i = 0.05. 10 E, 20 E, 50 0.19 0.60182 0.34824…
A: Given the life table with i=0.05 x Ax Ex10 Ex20 50 0.19 0.60182 0.34824 60 0.29 0.57864…
Q: Compute a 95% confidence interval for the mean economic dynamism of middle-income countries by…
A:
Q: Interpret the Coefficient of Determination New Cases New Deaths 1765 4 1097 5 891 4 959 6 937 58…
A: Coefficient of determination is the square of correlation coefficient. Correlation coefficient is…
Q: Table 1. Mid-year population and number of deaths by age and gender in a country in a certain year…
A: The age specific death rates for the specific age groups is the ratio of number of deaths which…
Q: From the data given below, calculate the gross and net reproduction rates : Age Group Female…
A:
Q: Listed below is information regarding organ transplantation for three different years. Based on…
A: The following contingency table is given regarding organ transplantation for three different years.…
Q: Use the information below to answer Questions #16 - 22. The article "Probabilistic Fatigue…
A: Given: exponential distribution with 9
Q: From the following data, estimate the population for the year 1996 using parabolic Example curve…
A: Solution is given:
Q: The results of an experimental drug trial to treat chronic stultitia are listed below. Women without…
A: Given data, P(Man in treatment 2 will show marked improvement)=?
Q: The economic dynamism, which is the index of productive growth (in dollars) for countries that are…
A: (iv) Obtain the t score for the 95% confidence level. The t score for the 95% confidence level…
Q: Table 1: Characteristics of Women According to Intake of Alcohol Variable Nondrinker* Drinker*…
A: Note: As per the guidelines, we are allowed to solve single question at a time when multiple…
Q: The prices and the numbers of various items produced by a small machine and stamping plant are…
A: Given 2010 2018 Item Price p0j Quantity q0j Price pij Quantity qij Washer 0.07 17,000…
Q: 15. Estimate the standardized death rates from the following data : Death Rate per 1000 008 Age…
A:
Answer the question in the image?
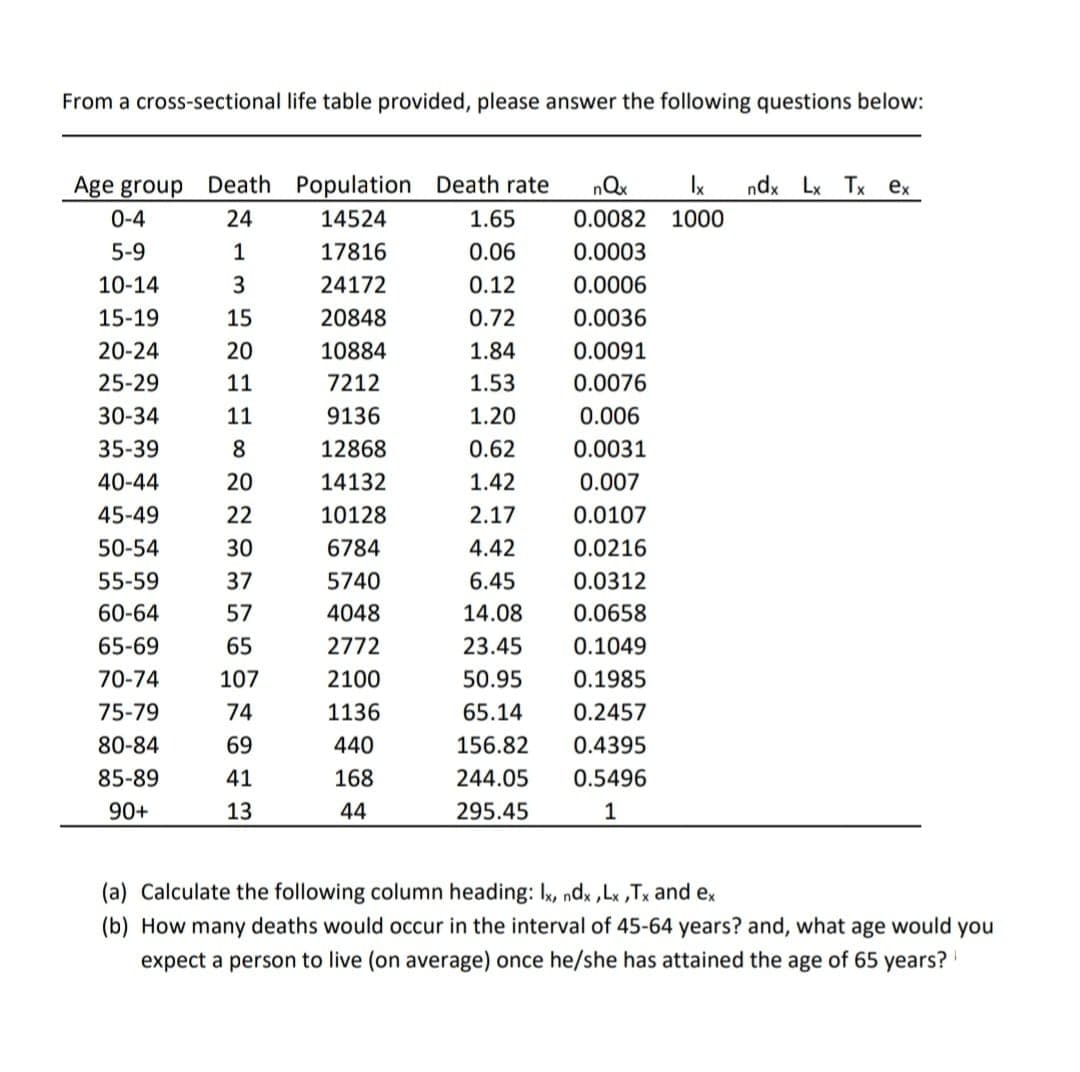
Step by step
Solved in 3 steps
- The following table cross-classifies pregnant women in the study by their body mass index (BMI) at 16 weeks gestation and whether they had pre-term delivery. What proportion of women with BMI greater than 35 delivers pre-term? BMI < 30 BMI 30–34.9 BMI 35+ Pre-term 320 80 120 Full term 4700 480 300 A)0.0867 B)0.2857 C)0.0533 D)0.533From a cross-sectional life table provided, answer the question below:The National Hurricane Center provides data that list the number of large (category 3, 4, or 5) hurricanes that have struck the United States, by decade, from 1851-2020. Is there sufficient evidence that the number of large hurricanes have remained constant (per decade)? What are the degrees of freedom? Decade Count Decade Count 1851-1860 6 1941-1950 10 1861-1870 1 1951-1960 8 1871-1880 7 1961-1970 6 1881-1890 5 1971-1980 4 1891-1900 8 1981-1990 5 1901-1910 4 1991-2000 5 1911-1920 7 2001-2010 8 1921-1930 5 2011-2020 10 1931-1940 8 Chi-squared test for given probabilitiesdata: stormsX-squared = 13.589, df = 16, p-value = 0.6293 A. 107 B. 17 C. 13.589 D. 16
- Is there a relationship between age and anemia?How sensitive to changes in water temperature are coral reefs? To find out, scientists examined data on sea surface temperatures, in degrees Celsius, and mean coral growth, in centimeters per year, over a several‑year period at locations in the Gulf of Mexico and the Caribbean Sea. The table shows the data for the Gulf of Mexico. Sea surface temperature 26.726.7 26.626.6 26.626.6 26.526.5 26.326.3 26.126.1 Growth 0.850.85 0.850.85 0.790.79 0.860.86 0.890.89 0.920.92 (b) Find the correlation ?r step by step. Round off to two decimals places in each step. First, find the mean and standard deviation of each variable. Then, find the six standardized values for each variable. Finally, use the formula for ?r . Round your answer to three decimal places.Recent publications have addressed the growing concern in the scientific community around the increased prevalence of CAT scans in children between the ages of 7-18 and the growing rate of childhood cancers. Suppose the researcher plans to gather a SRS from a group of children in this age range who have received one or more CAT scans, and a SRS from a group of children who have never received a CAT scan and compare the number of cases of childhood cancers that develop over a prolonged period of time. Assume the following table summarizes the descriptive statistics for his samples. Population Average cases of childhood cancers Standard deviaton Sample size >CAT scan 24.6 2.4 1,894 No CAT scans 11.4 1.9 2,745 A) Carry out the appropriate statistical test to answer the researcher’s hypothesis regarding the difference in average cases of childhood cancers in children aged 7-18 receiving one or more CAT scans versus those that have never received a CAT scan. Use an alpha level…