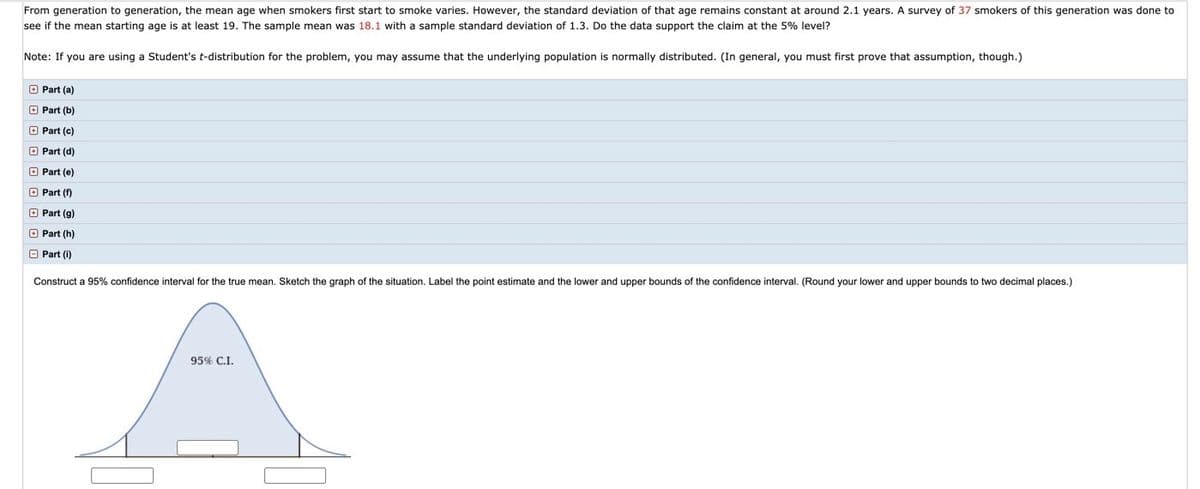
From generation to generation, the mean age when smokers first start to smoke varies. However, the standard deviation of that age remains constant at around 2.1 years. A survey of 37 smokers of this generation was done to see if the mean starting age is at least 19. The sample mean was 18.1 with a sample standard deviation of 1.3. Do the data support the claim at the 5% level? Note: If you are using a Student's t-distribution for the problem, you may assume that the underlying population is normally distributed. (In general, you must first prove that assumption, though.) O Part (a) O Part (b) O Part (c) O Part (d) O Part (e) O Part () O Part (g) O Part (h) O Part (i) Construct a 95% confidence interval for the true mean. Sketch the graph of the situation. Label the point estimate and the lower and upper bounds of the confidence interval. (Round your lower and upper bounds to two decimal places.) 95% C.I.


Unitary Method
The word “unitary” comes from the word “unit”, which means a single and complete entity. In this method, we find the value of a unit product from the given number of products, and then we solve for the other number of products.
Speed, Time, and Distance
Imagine you and 3 of your friends are planning to go to the playground at 6 in the evening. Your house is one mile away from the playground and one of your friends named Jim must start at 5 pm to reach the playground by walk. The other two friends are 3 miles away.
Profit and Loss
The amount earned or lost on the sale of one or more items is referred to as the profit or loss on that item.
Units and Measurements
Measurements and comparisons are the foundation of science and engineering. We, therefore, need rules that tell us how things are measured and compared. For these measurements and comparisons, we perform certain experiments, and we will need the experiments to set up the devices.
How do I complete this? Any help would be great and useful


Trending now
This is a popular solution!

Step by step
Solved in 2 steps with 1 images


