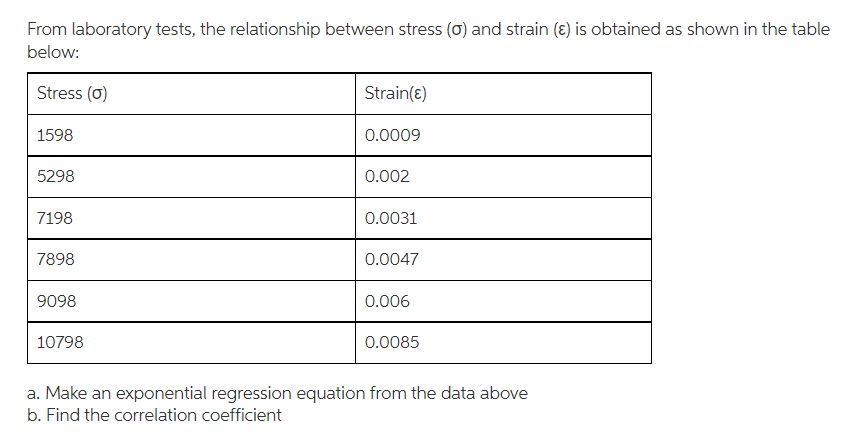
From laboratory tests, the relationship between stress (0) and strain (ɛ) is obtained as shown in the table below: Stress (0) Strain(E) 1598 0.0009 5298 0.002 7198 0.0031 7898 0.0047 9098 0.006 10798 0.0085 a. Make an exponential regression equation from the data above b. Find the correlation coefficient


Q: 1. Obtain the regression of Y on Xa' ´from the following table and estimate the blood pressure when…
A:
Q: Use the Atmospheric Carbon Dioxide Concentration scatterplot below to answer the questions.…
A:
Q: By using the following data, find out the two lines of regression and from them compute the Karl…
A: n=N=10, ∑x=250, ∑Y=300, ∑XY=7900, ∑X2=6500, ∑Y2=10000
Q: The table below shows the population of a fictional California Gold Rush Town named Lehi in the…
A: Hello. Since your question has multiple parts, we will solve the first part for you. If you want…
Q: In a study of the relationship between real aggregate consumption and prices in a specific country…
A:
Q: The sales from company ABC for the years 1998 - 2003 are given below. Year 1998 1999 2000 2001 2002…
A: Given:- The sales from company ABC for the years 1998 - 2003 are given below. Year 1998…
Q: For the regression equation, Ŷ = –2X + 6, what can be determined about the correlation between X and…
A: The given regression line is: Ŷ = –2X + 6
Q: he table shows the age of a painting (x) in years, and its estimated dollar value (y). x2 y 1,200…
A:
Q: 4. Y = 0.43X + 1.1; X = 0.97 5. Y = X +:X = 6. Assume that the height of fathers (X) and the height…
A:
Q: The following table shows the number of full-time faculty that WVU has on staff throughout the…
A:
Q: By using the following data, find out the two lines of regression and from them com- pute the Karl…
A:
Q: Suppose you obtain the following regression model, E[y]=67+75*x. What is the impact of a 92 unit…
A: We have given that, The regression model is, E(Y) = 67+ 75*x Then, We will find What is the…
Q: Fit a nonlinear regression equation of the form y = aX® to the following data: 5 1 2 3 4 2.98 4.26…
A: The power regression technique uses a dataset to determine a function, y=axb such that the data set…
Q: 1. The design life of a planned municipal water-distribution system is to end in 2050, and the…
A: The equation for the logistic model is given as Pt=PSat1+ea+b∆t. Where Pt=Population at time t in…
Q: A group of students measure the length and width of a random sample of beans. They are interested in…
A: d) Compute the estimated slope of the regression line using the formula: b=rsysx Where, 'b' is the…
Q: The regression results below show the relationship between GDP (Y) and private consumption (X) for…
A: Simple linear Regression model : Linear Regression analysis is used to measure the association or…
Q: Solve the following numerical problems and provide all your pertinent solutions: Sketch a graph and…
A:
Q: 15. The following calculations have been made for the price of 12 stocks (X) on BSE on a certain day…
A: Since you have asked multiple question, we will solve the first question for you. If you want any…
Q: The following data were used in a regression study. Observation 1 2 3 4 567 8 9 2 3 45777| 8 5 4 6 4…
A: Excel Procedure: Enter x and y in Excel>Data>Data Analysis> ‘Regression’>Select y under…
Q: In a small summer course, Professor Blinky wants to compare the number of homework completed to…
A: Given Information: X (Homework Completed) Y (Final Grades) 7 86 8 94 4 76 3 45…
Q: Consider the data in the table below. X 1 5 4 8 3 2 1 7 2)| The slope coefficient for a regression…
A: As per our guidelines we can solve first three sub part of question and rest can be reposted.…
Q: Use multiple linear regression to fit the following tabulated data: х1 1 1 8 8. x2 6. y 14 21 11 12…
A: Given data, x1 x2 y 1 0 14 3 2 21 1 2 11 8 4 12 2 4…
Q: The population of a certain country from 1970 through 2010 is shown in the table x, Number of Years…
A: From the given information, The original data can be expressed as: X Y 1 208.7 11 240.5 21…
Q: In an study similar to the one in Exercise 3, the relative humidity and ozone levels were measured…
A: a. From the output, Slope =-0.13468 ≈ -0.135 b. The sample size is 120. The degrees of…
Q: Consider the following regression output: = 0.2033 + 0.656Xt se = (0.0976) (0.1961) r² = 0.397 RSS =…
A: Given: - Regression output y^b=0.2033+0.656xt Interpretation of Regression line: for Every P unit…
Q: The following table shows the annual number of PhD graduates in a country in various fields.…
A: Step-by-step procedure to find the regression equation using Excel: In Excel sheet, enter Year in…
Q: The following table shows the annual number of PhD graduates in a country in various fields. Natural…
A:
Q: For the data given below from a simple linear regression model, the computed value of the sum square…
A: The formula of SSE is,
Q: (7) Consider the model log(wage) = 2.289 – .357 female + .50 totcoll + .030 female · totcoll (.003)…
A: i) Given, totcoll=2 years, female=1 (for a woman) Predicted log…
Q: Consider the following regression output: Ît = 0.2033 +0.656Xt se (0.0976) (0.1961) r² = 0.397…
A:
Q: Find the mean of the variables X and Y and correlation coefficient, given the following: Regression…
A: Given two regression equations Y on X : 2Y-X-50=0 ........1X on Y : 3Y-2X-10=0 ........2
Q: A study was done that examined the effectiveness of a 7-Minute Screen test for Alzheimer’s disease.…
A:
Q: The following table shows the annual number of PhD graduates in a country in various fields.…
A: a) From the given information, Social sciences(y) Year(t) 60 1990 100 1995 280 2000 470…
Q: If a correlation is r= 0.00, then SP = 0 and the regression equation is O Ý =X +0 O Ý =X + X O Ý =0…
A: Given: correlation is r = 0.00, then SP = 0
Q: For the data shown below, Find the best -fit regression equation. 1.661 1.931| 0.545 0.186 0.010…
A: Step-by-step procedure to find the regression equation using Excel: In Excel sheet, enter X in one…
Q: Complete the following table and calculate the correlation coefficient, regression Yield (flowers),…
A:
Q: 13) Use computer software to find the multiple regression equation. Can the equation be used for…
A:
Q: The table below shows the population of a fictional California Gold Rush Town named Lehi in the ye…
A:
Q: 1. A simple random sample of golfers provides the following statistics: No. of hours of playing per…
A: In multiple linear regression, there will be more than one independent variable. In simple linear…
Q: mple in 2020 are shown on the table below. Solve the following: 1. Correlational Analysis 2.…
A: 1. Correlation analysis: This analysis is used to determine whether there is association between Net…
Q: Data on the relationship between plant age and dry matter in the stalk are given in the Table. X…
A:
Q: i) Express the relationship between the exhausted age and dry matter level with the regression…
A: X (Age) Y (Dry matter) (x-xbar) (x-xbar)^2 (y-ybar) (y-ybar)^2 (x-xbar)*(y-ybar) 4 24 -7 49 -17.25…
Q: The mortality rate of a sample of the population as a function of daily tobacco consumption can be…
A: Given data :
Q: The following table gives the regression results of consumption behaviour between female and male.…
A: Note: Hey there! Thank you for the question. As you have posted multiple sub-parts, we have helped…
Q: The dataset below contains synthetic records of human heights and weights of 18 years old children.…
A: “Since you have asked multiple questions, we will solve the first question for you. If you want any…
Q: Suppose you obtain the following regression model, E[y]=91+79*x1 +20*x1*x2. What is the impact of a…
A: *Answer:
Q: The systolic blood pressure of individuals is thought to be related to both age and weight. For a…
A: We can conduct a multiple regression analysis with the help of excel itself use the same regression…
Q: Consider a simple regression equation (y = bo + b,x + e). If the coefficient of determination is…
A: Given,coefficient of determination (R2)=0.64
Q: The accompanying table provides data for tar, nicotine, and carbon monoxide (CO) contents in a…
A: Regression equation is found using Excel. The steps to calculate simple regression are- 1) Go to the…
Q: For the following data: Y 1 5 2 10 9. 3 12 11 4 13 Find the regression equation for predicting Y…
A:

Step by step
Solved in 3 steps

- What does the y -intercept on the graph of a logistic equation correspond to for a population modeled by that equation?Olympic Pole Vault The graph in Figure 7 indicates that in recent years the winning Olympic men’s pole vault height has fallen below the value predicted by the regression line in Example 2. This might have occurred because when the pole vault was a new event there was much room for improvement in vaulters’ performances, whereas now even the best training can produce only incremental advances. Let’s see whether concentrating on more recent results gives a better predictor of future records. (a) Use the data in Table 2 (page 176) to complete the table of winning pole vault heights shown in the margin. (Note that we are using x=0 to correspond to the year 1972, where this restricted data set begins.) (b) Find the regression line for the data in part ‚(a). (c) Plot the data and the regression line on the same axes. Does the regression line seem to provide a good model for the data? (d) What does the regression line predict as the winning pole vault height for the 2012 Olympics? Compare this predicted value to the actual 2012 winning height of 5.97 m, as described on page 177. Has this new regression line provided a better prediction than the line in Example 2?The following fictitious table shows kryptonite price, in dollar per gram, t years after 2006. t= Years since 2006 0 1 2 3 4 5 6 7 8 9 10 K= Price 56 51 50 55 58 52 45 43 44 48 51 Make a quartic model of these data. Round the regression parameters to two decimal places.
- Table 2 shows a recent graduate’s credit card balance each month after graduation. a. Use exponential regression to fit a model to these data. b. If spending continues at this rate, what will the graduate’s credit card debt be one year after graduating?The birth lengths in cm (x) and birth weights in kg (y) of a sample of 50 newborn female babies are compared, yielding a correlation coefficient of r=0.578 and a linear regression equation of ŷ =−8.89+0.243x The babies all had lengths between 46.5 and 53.0 cm, and weights between 2.50 and 4.05 kg. Based on this, predict the birth weight of a newborn female baby with a birth length of 48.5 cm.Consider the following regression equation representing the linear relationship between the Canada Child Benefit provided for a married couple with 3 children under the age of 6, based on their annual family net income: ŷ =121.09−0.57246xR2=0.894 where y = annual Canada Child Benefit paid (in $100s) x = net annual family income (in $1000s) Source: Canada Revenue Agency a. As the net annual family income increases, does the Canada Child Benefit paid increase or decrease? Based on this, is the correlation between the two variables positive or negative?The Canada Child Benefit paid .The correlation between the two variables is .b. Calculate the correlation coefficient and determine if the relationship between the two variables is strong, moderate or weak.r= , the relationship is . Round to 3 decimal places c. Interpret the value of the slope as it relates to this relationship. For every $1 increase in annual family net income, there is a $0.57246 decrease in…
- Consider the following regression equation representing the linear relationship between the Canada Child Benefit provided for a married couple with 3 children under the age of 6, based on their annual family net income: ŷ =121.09−0.57246xR2=0.894 where y= annual Canada Child Benefit paid (in $100s) x = net annual family income (in $1000s) Source: Canada Revenue Agency a. As the net annual family income increases, does the Canada Child Benefit paid increase or decrease? Based on this, is the correlation between the two variables positive or negative?The Canada Child Benefit paid ? .The correlation between the two variables is ? .b. Calculate the correlation coefficient and determine if the relationship between the two variables is strong, moderate or weak.r= , the relationship is ? . Round to 3 decimal places c. Interpret the value of the slope as it relates to this relationship. For every $1 increase in annual family net income, there is a $0.57246 decrease in…An investigation into the relationship between an adolescent mother's age x in years and the birth weight y of her baby in grams yielded the regression equation y= - 1163.45 + 245.15x as well as r = .88369, r2= .78091, SSE = 337212.45, and s= 205.30844 1) What is the predicted birth weight for a baby brn to a 17 year old woman? 2) What is the propotion of the variability in the weights of babies born to adolescent mothers that is accounted for by the mother's age? 3) For every additional year in the mother's age that mean birth weight of the baby? (a) increases by about 245g (b) decreases by about 245g (c) increases by about 1163g (d) increases by about 1163g (e) changes by an amount that cannot be determined from the information given.It is known that the linear regression equation: y= -2.88+1.77x, with a coefficient of determination of 0.81. Based on the two information, the correlation coefficient is
- The following estimated regression model was developed relating yearly income (Y in $1,000s) of 30 individuals with their age in years (X1) and their gender (X2) (0 if male and 1 if female). The yearly income of a 24-year-old female individual isAssume that there is a positive linear correlation between the variable R (return rate in percent of financial investment) and the variable t (age in years of the investment) given by the regression equation R = 2.5t + 5.3. 1- Without further information, can we assume there is a cause-and-effect relationship between the return rate and the age of the investment? 2- If the investment continues to grow at a constant rate, what is the expected return rate when the investment is 7 years old? 3- If the investment continues to grow at a constant rate, how old is the investment when the return rate is 32.8%?Assume that there is a positive linear correlation between the variable R (return rate in percent of financial investment) and the variable t (age in years of the investment) given by the regression equation R = 2.5t + 5.3. 1- If the investment continues to grow at a constant rate, what is the expected return rate when the investment is 7 years old?

