1. The design life of a planned municipal water-distribution system is to end in 2050, and the population in the town has been measured every 10 years since 1930 by the US Census Bureau. The reported populations are given below. Year Population 1930 25521 1940 30208 1950 30721 1960 37253 1970 38302 1980 41983 1990 56451 2000 64109 Assuming the population growth follows the logistic curve pattern, a) Perform a non-linear regression to fit the historical data to the logistic curve equation, and estimate the populations in 2050 assuming four different scenarios where the Psat is 100, 110, 120 and 130 thousand people. Also determine coefficients a and b of the logistic model for each scenario.
1. The design life of a planned municipal water-distribution system is to end in 2050, and the population in the town has been measured every 10 years since 1930 by the US Census Bureau. The reported populations are given below. Year Population 1930 25521 1940 30208 1950 30721 1960 37253 1970 38302 1980 41983 1990 56451 2000 64109 Assuming the population growth follows the logistic curve pattern, a) Perform a non-linear regression to fit the historical data to the logistic curve equation, and estimate the populations in 2050 assuming four different scenarios where the Psat is 100, 110, 120 and 130 thousand people. Also determine coefficients a and b of the logistic model for each scenario.

MATLAB: An Introduction with Applications
6th Edition
ISBN:9781119256830
Author:Amos Gilat
Publisher:Amos Gilat
Chapter1: Starting With Matlab
Section: Chapter Questions
Problem 1P

Related questions
Question
100%
Plz write neat
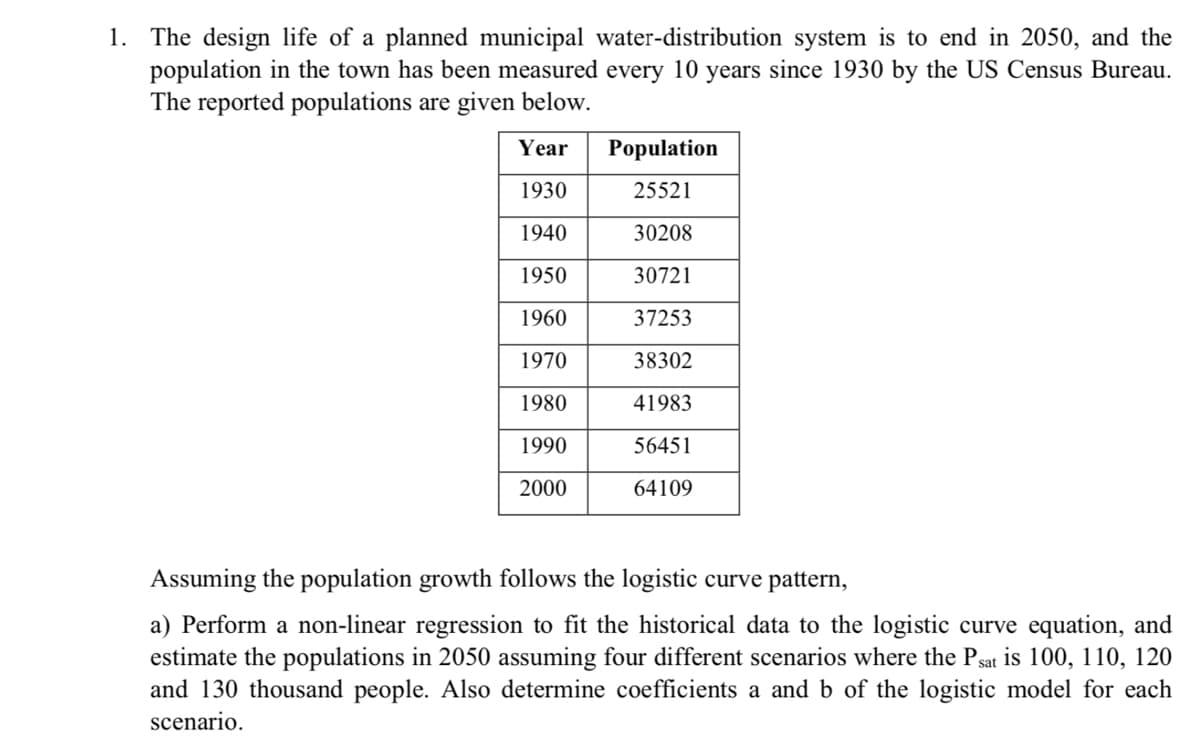
Transcribed Image Text:1. The design life of a planned municipal water-distribution system is to end in 2050, and the
population in the town has been measured every 10 years since 1930 by the US Census Bureau.
The reported populations are given below.
Year
Population
1930
25521
1940
30208
1950
30721
1960
37253
1970
38302
1980
41983
1990
56451
2000
64109
Assuming the population growth follows the logistic curve pattern,
a) Perform a non-linear regression to fit the historical data to the logistic curve equation, and
estimate the populations in 2050 assuming four different scenarios where the Psat is 100, 110, 120
and 130 thousand people. Also determine coefficients a and b of the logistic model for each
scenario.
Expert Solution
This question has been solved!
Explore an expertly crafted, step-by-step solution for a thorough understanding of key concepts.

This is a popular solution!

Trending now
This is a popular solution!

Step by step
Solved in 4 steps

Knowledge Booster


Learn more about
Need a deep-dive on the concept behind this application? Look no further. Learn more about this topic, statistics and related others by exploring similar questions and additional content below.Recommended textbooks for you
MATLAB: An Introduction with Applications
Statistics
ISBN:
9781119256830
Author:
Amos Gilat
Publisher:
John Wiley & Sons Inc

Probability and Statistics for Engineering and th…
Statistics
ISBN:
9781305251809
Author:
Jay L. Devore
Publisher:
Cengage Learning

Statistics for The Behavioral Sciences (MindTap C…
Statistics
ISBN:
9781305504912
Author:
Frederick J Gravetter, Larry B. Wallnau
Publisher:
Cengage Learning
MATLAB: An Introduction with Applications
Statistics
ISBN:
9781119256830
Author:
Amos Gilat
Publisher:
John Wiley & Sons Inc
Probability and Statistics for Engineering and th…
Statistics
ISBN:
9781305251809
Author:
Jay L. Devore
Publisher:
Cengage Learning
Statistics for The Behavioral Sciences (MindTap C…
Statistics
ISBN:
9781305504912
Author:
Frederick J Gravetter, Larry B. Wallnau
Publisher:
Cengage Learning

Elementary Statistics: Picturing the World (7th E…
Statistics
ISBN:
9780134683416
Author:
Ron Larson, Betsy Farber
Publisher:
PEARSON

The Basic Practice of Statistics
Statistics
ISBN:
9781319042578
Author:
David S. Moore, William I. Notz, Michael A. Fligner
Publisher:
W. H. Freeman

Introduction to the Practice of Statistics
Statistics
ISBN:
9781319013387
Author:
David S. Moore, George P. McCabe, Bruce A. Craig
Publisher:
W. H. Freeman