
Database System Concepts
7th Edition
ISBN: 9780078022159
Author: Abraham Silberschatz Professor, Henry F. Korth, S. Sudarshan
Publisher: McGraw-Hill Education
expand_more
expand_more
format_list_bulleted
Related questions
Question
: Animating a Plot Problem: The MATLAB code with the initial conditions and one dimensional motion equation are given in the MProject2_Assignment1_base.m file. Modify the code to explore how to animate the plot, use functions to create plot function

Transcribed Image Text:EENG 3308 Programming Languages for Design
Mini Pragert 2
Poing 2
Assignment 1: Animating a Plot (Slovot
Problem: The MATLAB code with the initial conditions and one dimensional motion equation are given
in the MProject2_Assignment1_base.m file. Modify the code to explore how to animate the plot , use
functions to create plot function.
Equation of motion in one dimension:
x(t) = x0 + vx *t+ (ax * t*2) /2 where a = acceleration
y(t) = y0 + vy *t + (ay t^2) /2
Initial condition
Vx - 10;
Vy = 20;
aY =-9.8
t= 0:5 (0 to 5 seconds) Note: You can also increment to 50 points using 0:0.1:5
for i = 1: length(t)
x(i) = vx * t(i)
y(i) = vy * t(i) + (ay * (6) ^2)/2
end
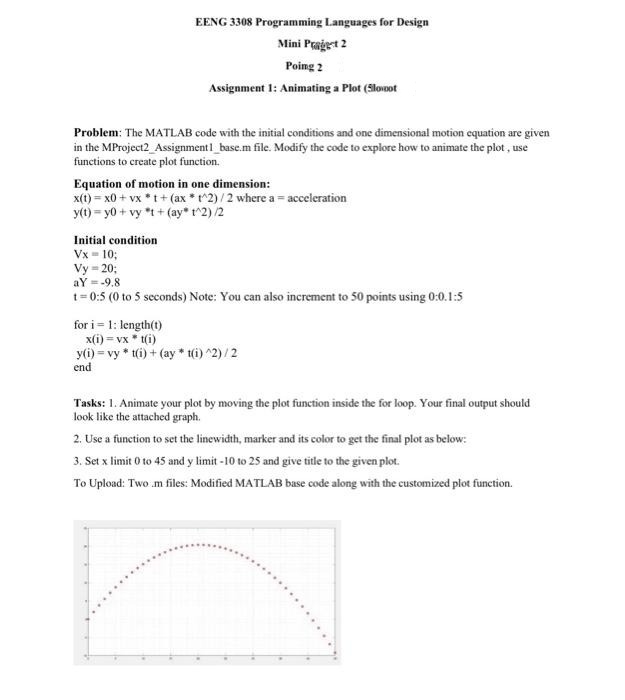
Tasks: 1. Animate your plot by moving the plot function inside the for loop. Your final output should
look like the attached graph.
2. Use a function to set the linewidth, marker and its color to get the final plot as below:
3. Set x limit 0 to 45 and y limit -10 to 25 and give title to the given plot.
To Upload: Two .m files: Modified MATLAB base code along with the customized plot function.
Expert Solution
This question has been solved!
Explore an expertly crafted, step-by-step solution for a thorough understanding of key concepts.

This is a popular solution

Trending nowThis is a popular solution!

Step by stepSolved in 2 steps with 1 images

Knowledge Booster


Learn more about
Need a deep-dive on the concept behind this application? Look no further. Learn more about this topic, computer-science and related others by exploring similar questions and additional content below.Similar questions
- in the C++ version please suppose to have a score corresponding with probabilities at the end and do not use the count[] function. Please explain the detail when coding. DO NOT USE ARRAY. The game of Pig The game of Pig is a dice game with simple rules: Two players race to reach 100 points. Each turn, a player repeatedly rolls a die until either a 1 ("pig") is rolled or the player holds and scores the sum of the rolls (i.e. the turn total). At any time during a player's turn, the player is faced with two decisions: roll - if the player rolls 1: the player scores nothing and it becomes the opponents turn. 2 - 6: the number is added to the player's turn total and the player's turn continues. hold - The turn total is added to the player's score and it becomes the opponent's turn. This game is a game of probability. Players can use their knowledge of probabilities to make an educated game decision. Assignment specifications Hold-at-20 means that the player will choose to roll…arrow_forward# dates and times with lubridateinstall.packages("nycflights13") library(tidyverse)library(lubridate)library(nycflights13) Qustion: Create a function called date_quarter that accepts any vector of dates as its input and then returns the corresponding quarter for each date Examples: “2019-01-01” should return “Q1” “2011-05-23” should return “Q2” “1978-09-30” should return “Q3” Etc. Use the flight's data set from the nycflights13 package to test your function by creating a new column called quarter using mutate()arrow_forwardMatlab Questionarrow_forward
- Give an example of a function with two arguments and statements that are executed when the function is called. -Provide details about the return statement and the purpose of your function. -Provide an example of an array and a vector. -Describe your experience using GitHub, GitLab, Git, or other versional control software in general. Explain what aspects of the GitHub process you are comfortable with and what areas you need more practice or help.arrow_forwardUSE PYTHON THANK YOUarrow_forward
arrow_back_ios
arrow_forward_ios
Recommended textbooks for you
- Database System ConceptsComputer ScienceISBN:9780078022159Author:Abraham Silberschatz Professor, Henry F. Korth, S. SudarshanPublisher:McGraw-Hill Education
 Starting Out with Python (4th Edition)Computer ScienceISBN:9780134444321Author:Tony GaddisPublisher:PEARSON
 Digital Fundamentals (11th Edition)Computer ScienceISBN:9780132737968Author:Thomas L. FloydPublisher:PEARSON
  C How to Program (8th Edition)Computer ScienceISBN:9780133976892Author:Paul J. Deitel, Harvey DeitelPublisher:PEARSON
 Database Systems: Design, Implementation, & Manag...Computer ScienceISBN:9781337627900Author:Carlos Coronel, Steven MorrisPublisher:Cengage Learning
 Programmable Logic ControllersComputer ScienceISBN:9780073373843Author:Frank D. PetruzellaPublisher:McGraw-Hill Education
Database System Concepts
Computer Science
ISBN:9780078022159
Author:Abraham Silberschatz Professor, Henry F. Korth, S. Sudarshan
Publisher:McGraw-Hill Education
Starting Out with Python (4th Edition)
Computer Science
ISBN:9780134444321
Author:Tony Gaddis
Publisher:PEARSON
Digital Fundamentals (11th Edition)
Computer Science
ISBN:9780132737968
Author:Thomas L. Floyd
Publisher:PEARSON
C How to Program (8th Edition)
Computer Science
ISBN:9780133976892
Author:Paul J. Deitel, Harvey Deitel
Publisher:PEARSON
Database Systems: Design, Implementation, & Manag...
Computer Science
ISBN:9781337627900
Author:Carlos Coronel, Steven Morris
Publisher:Cengage Learning
Programmable Logic Controllers
Computer Science
ISBN:9780073373843
Author:Frank D. Petruzella
Publisher:McGraw-Hill Education