
MATLAB: An Introduction with Applications
6th Edition
ISBN: 9781119256830
Author: Amos Gilat
Publisher: John Wiley & Sons Inc
expand_more
expand_more
format_list_bulleted
Related questions
Question

Transcribed Image Text:aragraph
Styles
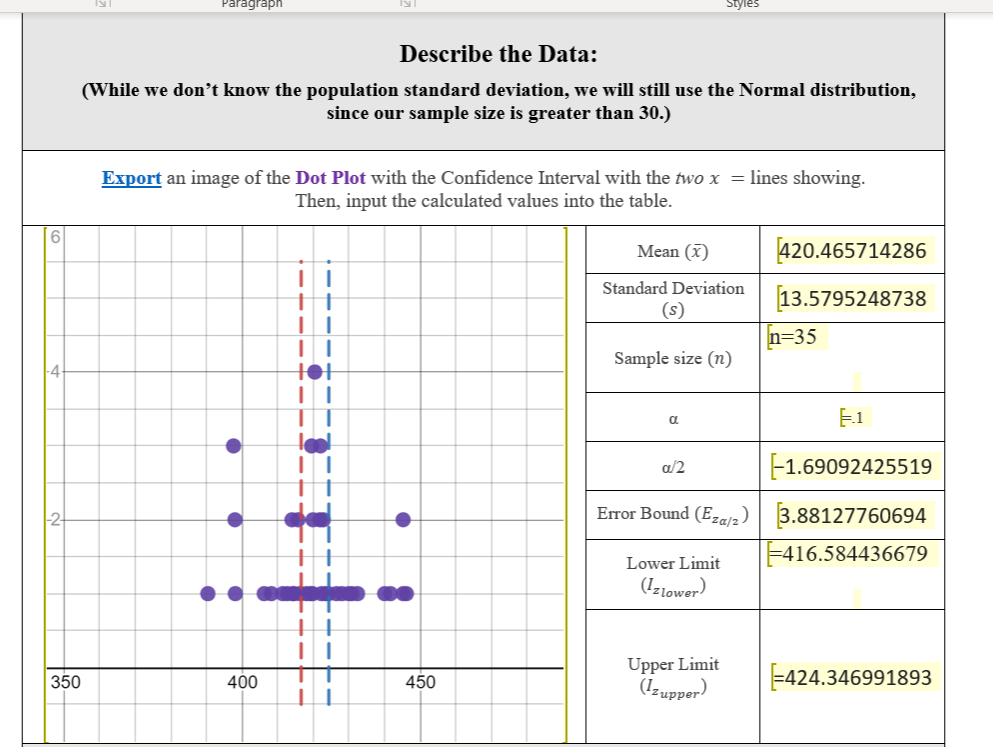
Describe the Data:
(While we don't know the population standard deviation, we will still use the Normal distribution,
since our sample size is greater than 30.)
Export an image of the Dot Plot with the Confidence Interval with the two x = lines showing.
Then, input the calculated values into the table.
6|
Mean (x)
420.465714286
Standard Deviation
13.5795248738
(s)
n=35
Sample size (n)
a/2
-1.69092425519
Error Bound (Eze/2) 3.88127760694
-416.584436679
Lower Limit
(Iztower)
Upper Limit
(Izupper)
350
400
450
=424.346991893

Transcribed Image Text:Some students think that a 90% confidence interval contains 90% of the data.
Using the dot plot from your link, count how many of the data
values lie within the confidence interval.
11
What percent of the data is this?
Is this percent close to 90%?
Discussion Questions:
(For each question, use one to two complete sentences to explain your answer.)
Explain why this percent should or
[
should not be close to 90%.
Explain what this confidence interval
means for this particular study.
Expert Solution
This question has been solved!
Explore an expertly crafted, step-by-step solution for a thorough understanding of key concepts.

This is a popular solution

Trending nowThis is a popular solution!

Step by stepSolved in 4 steps with 1 images

Knowledge Booster

Similar questions
- You want to estimate the percentage of statistics students who get grades of C or better. How many students should you survey to be 95% confident that the sample percentage is off by no more than 2 percentage points.arrow_forward??arrow_forwardPlease help by providing detailed explanation to answers. Thanks Feel free to use the Normal table and the table attachedarrow_forward
- What does the percentile ranking tell us? What percent of the data is below a given point. O What percent of the data is above a given point. O What percent of the data is close to a given point. O What percent of the data supports a given point.arrow_forwardUsing the same data and information. Please answer this: Should you be encouraging or discouraging credit card sales? In answering this question, consider the following: Is the proportion of credit and non-credit sales significantly different? (a=.05) Is the average sale amount for credit sales different than the average sales amount for non-credit sales? (a=.05)arrow_forwardFind the percentile rank for each value in the data set. The data represent the values in billions of dollars of the damage of 6 hurricanes. Round to the nearest whole percentile. 2.3, 3.3, 6.2, 7.9, 9.6,11.3arrow_forward
- The first picture is the question and the second is the ones that I need help with. Thanksarrow_forwardWhen finding percentile ranks for a percentile, the focus is always on identifying the percentile rank on the left side of a percentile. O True O Falsearrow_forwardyour car is more crowded than you think. table 5.8 reports results from a 1969 personal transportation survey on "home-to-work" trips in metropolitan areas. The survey stated that the average car occupancy was 1.4 people. check that calculation.arrow_forward
arrow_back_ios
arrow_forward_ios
Recommended textbooks for you
- MATLAB: An Introduction with ApplicationsStatisticsISBN:9781119256830Author:Amos GilatPublisher:John Wiley & Sons Inc
 Probability and Statistics for Engineering and th...StatisticsISBN:9781305251809Author:Jay L. DevorePublisher:Cengage Learning
 Statistics for The Behavioral Sciences (MindTap C...StatisticsISBN:9781305504912Author:Frederick J Gravetter, Larry B. WallnauPublisher:Cengage Learning
  Elementary Statistics: Picturing the World (7th E...StatisticsISBN:9780134683416Author:Ron Larson, Betsy FarberPublisher:PEARSON
 The Basic Practice of StatisticsStatisticsISBN:9781319042578Author:David S. Moore, William I. Notz, Michael A. FlignerPublisher:W. H. Freeman
 Introduction to the Practice of StatisticsStatisticsISBN:9781319013387Author:David S. Moore, George P. McCabe, Bruce A. CraigPublisher:W. H. Freeman
MATLAB: An Introduction with Applications
Statistics
ISBN:9781119256830
Author:Amos Gilat
Publisher:John Wiley & Sons Inc
Probability and Statistics for Engineering and th...
Statistics
ISBN:9781305251809
Author:Jay L. Devore
Publisher:Cengage Learning
Statistics for The Behavioral Sciences (MindTap C...
Statistics
ISBN:9781305504912
Author:Frederick J Gravetter, Larry B. Wallnau
Publisher:Cengage Learning
Elementary Statistics: Picturing the World (7th E...
Statistics
ISBN:9780134683416
Author:Ron Larson, Betsy Farber
Publisher:PEARSON
The Basic Practice of Statistics
Statistics
ISBN:9781319042578
Author:David S. Moore, William I. Notz, Michael A. Fligner
Publisher:W. H. Freeman
Introduction to the Practice of Statistics
Statistics
ISBN:9781319013387
Author:David S. Moore, George P. McCabe, Bruce A. Craig
Publisher:W. H. Freeman