Given below are the numbers of indoor movie theaters, listed in order by row for each year. Use the given data to construct a time-series graph. What is the trend? How does this trend compare to the trend for drive-in movie theaters? FER Click the lcon to view the indoor movie theater data. Construct a time-series graph with the year on the horizontal axis and the number of theaters on the vertical axis. A. OB. OC. OD. 36000 32000 28000 24000 20000 36000 32000 28000 24000 20000 36000 32000 36000 32000 28000 24000 20000 28000 24000 20000 0481216 0481216 048 1216 0481216 What is the trend? How does this trend compare to the trend for drive-in movie theaters? O A. There appears to be an downward trend, similar to drive-in movie theaters, which also have a downward trend. O B. There appears to be an upward trend, unlike drive-in movie theaters, which have a downward trend. OC. There appears to be an upward then downward trend, unlike drive-in movie theaters, which only have a downward trend. Indoor Movie Theater Data Year Number of Indoor Theaters 1 20,595 19,886 21,907 2 3 4 21,837 23,740 26,147 24,789 28,731 26,995 28,865 31,050 7 10 11 12 31,137 13 36,448 34,159 34,490 35,580 35,361 14 15 16 Next 17
Given below are the numbers of indoor movie theaters, listed in order by row for each year. Use the given data to construct a time-series graph. What is the trend? How does this trend compare to the trend for drive-in movie theaters? FER Click the lcon to view the indoor movie theater data. Construct a time-series graph with the year on the horizontal axis and the number of theaters on the vertical axis. A. OB. OC. OD. 36000 32000 28000 24000 20000 36000 32000 28000 24000 20000 36000 32000 36000 32000 28000 24000 20000 28000 24000 20000 0481216 0481216 048 1216 0481216 What is the trend? How does this trend compare to the trend for drive-in movie theaters? O A. There appears to be an downward trend, similar to drive-in movie theaters, which also have a downward trend. O B. There appears to be an upward trend, unlike drive-in movie theaters, which have a downward trend. OC. There appears to be an upward then downward trend, unlike drive-in movie theaters, which only have a downward trend. Indoor Movie Theater Data Year Number of Indoor Theaters 1 20,595 19,886 21,907 2 3 4 21,837 23,740 26,147 24,789 28,731 26,995 28,865 31,050 7 10 11 12 31,137 13 36,448 34,159 34,490 35,580 35,361 14 15 16 Next 17

Big Ideas Math A Bridge To Success Algebra 1: Student Edition 2015
1st Edition
ISBN:9781680331141
Author:HOUGHTON MIFFLIN HARCOURT
Publisher:HOUGHTON MIFFLIN HARCOURT
Chapter11: Data Analysis And Displays
Section: Chapter Questions
Problem 8CR

Related questions
Question
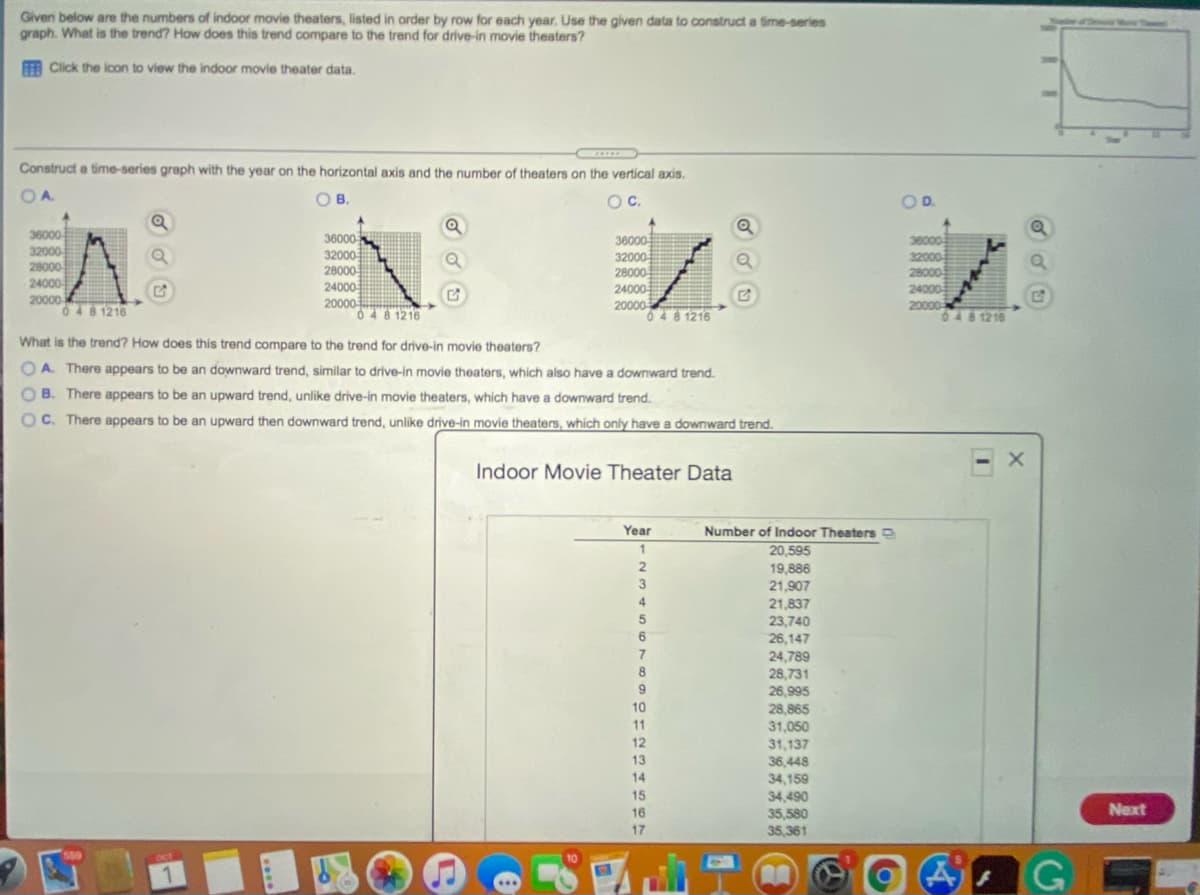
Transcribed Image Text:Given below are the numbers of indoor movie theaters, listed in order by row for each year. Use the given data to construct a time-series
graph. What is the trend? How does this trend compare to the trend for drive-in movie theaters?
Fm Click the lcon to view the indoor movie theater data.
C
Construct a time-series graph with the year on the horizontal axis and the number of theaters on the vertical axis.
OB.
OC.
OD.
36000
32000
28000
24000
20000
0481216
36000
32000
28000
24000
36000
36000
32000
28000
24000
20000
048 1216
32000
28000
24000
20000
0481216
20000
0481216
What is the trend? How does this trend compare to the trend for drive-in movie theaters?
O A. There appears to be an downward trend, similar to drive-in movie theaters, which also have a downward trend.
O B. There appears to be an upward trend, unlike drive-in movie theaters, which have a downward trend.
OC. There appears to be an upward then downward trend, unlike drive-in movie theaters, which only have a downward trend.
Indoor Movie Theater Data
Year
Number of Indoor Theaters
1
20,595
19,886
21,907
3
4
21,837
23,740
26,147
24,789
28,731
26,995
28,865
31,050
31,137
36,448
34,159
34,490
35,580
35,361
10
11
12
13
14
15
16
Next
17
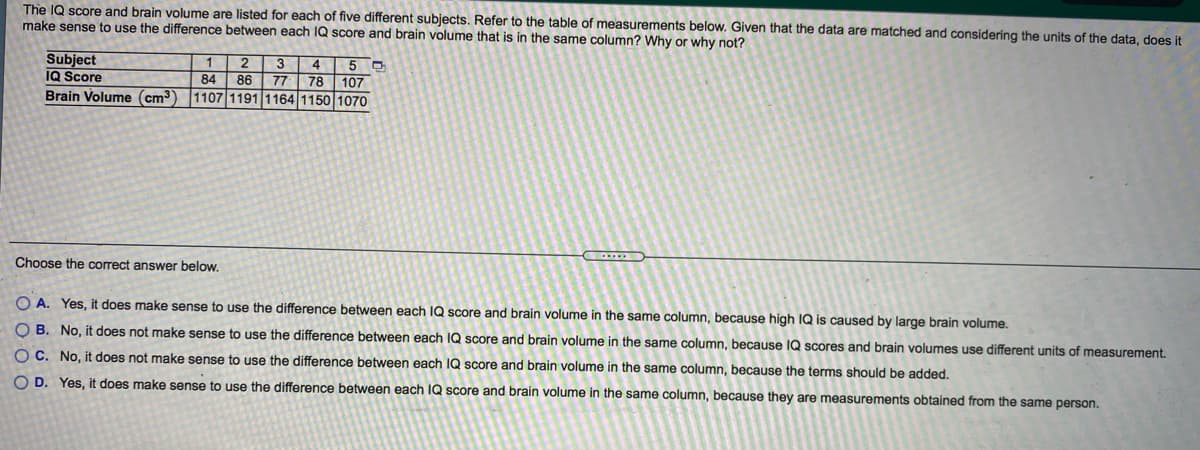
Transcribed Image Text:The IQ score and brain volume are listed for each of five different subjects. Refer to the table of measurements below. Given that the data are matched and considering the units of the data, does it
make sense to use the difference between each IQ score and brain volume that is in the same column? Why or why not?
Subject
IQ Score
Brain Volume (cm3
1.
2
3
4
84
86
77
78
107
1107 1191 1164 1150 1070
Choose the correct answer below.
O A. Yes, it does make sense to use the difference between each IQ score and brain volume in the same column, because high IQ is caused by large brain volume.
O B. No, it does not make sense to use the difference between each IQ score and brain volume in the same column, because IQ scores and brain volumes use different units of measurement.
O C. No, it does not make sense to use the difference between each IQ score and brain volume in the same column, because the terms should be added.
O D. Yes, it does make sense to use the difference between each IQ score and brain volume in the same column, because they are measurements obtained from the same person.
Expert Solution
This question has been solved!
Explore an expertly crafted, step-by-step solution for a thorough understanding of key concepts.

This is a popular solution!

Trending now
This is a popular solution!

Step by step
Solved in 2 steps

Recommended textbooks for you
Big Ideas Math A Bridge To Success Algebra 1: Stu…
Algebra
ISBN:
9781680331141
Author:
HOUGHTON MIFFLIN HARCOURT
Publisher:
Houghton Mifflin Harcourt

Glencoe Algebra 1, Student Edition, 9780079039897…
Algebra
ISBN:
9780079039897
Author:
Carter
Publisher:
McGraw Hill
Big Ideas Math A Bridge To Success Algebra 1: Stu…
Algebra
ISBN:
9781680331141
Author:
HOUGHTON MIFFLIN HARCOURT
Publisher:
Houghton Mifflin Harcourt
Glencoe Algebra 1, Student Edition, 9780079039897…
Algebra
ISBN:
9780079039897
Author:
Carter
Publisher:
McGraw Hill