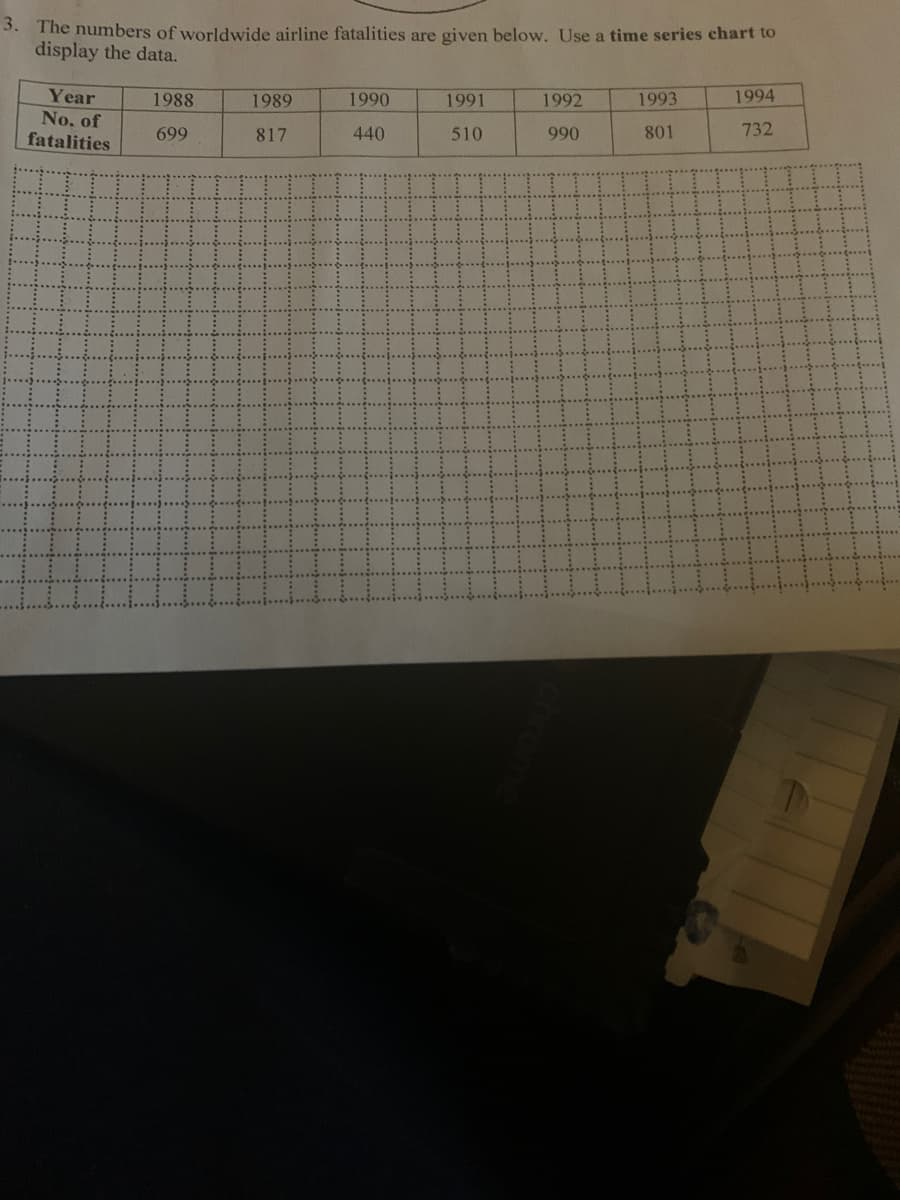
The numbers of worldwide airline fatalities are given below. Use a time series chart to display the data. Year 1988 1989 1990 1991 1992 1993 1994 No. of fatalities 699 817 440 510 990 801 732
Q: Calculate the Seasonal Index from the following data using the average method : Year 1st Quarter 2nd…
A:
Q: The following information is from General Electric Corporation's annual reports. General Electric…
A: We have to calculate the index number for the employees over different time periods. Consider 2013…
Q: 75% of all years have an FTES in the following ranges. (Enter exact numbers as integers, fractions,…
A: The summary statistics for full-time equivalent number of students (FTES) is given.
Q: the values of alabama building contracts (in $ millions) for a 12-month period follow.240 350 230…
A: From the given data set the time series plot can be plotted by following the steps as written below:…
Q: The following table gives the number of babies born in the United States for each month of 1984. The…
A: Steps to draw time series chart in Excel: Enter the data in Excel. Select the data. Choose…
Q: 7. For items 7-10, refer to table A below Table A Cumulative Cumulative Score Frequency Frequency…
A: The k-th percentile of a distribution corresponds to a point with the property that k% of the…
Q: Cumulative frequencies are used along the Y axis in the construction of the graph a. Time series…
A:
Q: .13. From the data given below, find the population for the year 1965. Year 1931 1941 1951 1961 1971…
A: Solution is given: Hope the answer is helpful.
Q: The cumulative frequency table below shows the marks carned by 1400 students in Mathematics and…
A: The Median is the mid point of the value. The median is the second quartile. The mid point of the…
Q: Given below are the numbers of indoor movie theaters, listed in order by row for each year. Use the…
A: Answer (1) i) Option (D) ✔️ ii) Option (B) ✔️. There appears to be an upward trend, unlike…
Q: The population of a certain city is shown in the following table during 1910 to 1950. Year…
A: Given: Year 1910 1920 1930 1940 1950Population (in thousands)…
Q: A. The data below shows the basic literacy rates in the Philippines from 1990-2008 by gender.…
A: Given: Year Female Male 1990 93 94 1994 94 93 2000 92 92 2003 90 87 2008 96 95
Q: You take a random sample of 50 people and record their body weight in kilograms. Surprisingly, there…
A: Given that we take a random sample of 50 people and record their body weight in kilograms.…
Q: Which components of time series data are evident in the graph shown below? 500- 400 - 300- 200 -…
A: The graph shown is between the time in year and the production of cars and shows a up and down…
Q: The values of Bahria building contracts (in Rupees millions) for a 12-month period follow. 240 350…
A: Given that following data first we plot
Q: Find the cumulative frequency and relative cumulative frequency and construct the Ogive for each of…
A:
Q: Calculate the seasonal index for the following data by using the average method. Year 1st Quarter…
A:
Q: Deseasonalise the following data with the help of the seasonal data given below. Seasona! Index…
A:
Q: The numbers of polio cases in the world are shown in the table for various years. Year Number of…
A: Consider the provided question, Let f(t) be the number of polio cases in thousands t years since…
Q: For the hawkins company, the monthly percentages of all shipments received on timeover the past 12…
A:
Q: The following frequency table contains the total number of deaths worldwide as a result of…
A: Solution: We have given frequency table that contains the total number of deaths worldwide as a…
Q: You take a random sample of 50 people and record their body weight in kilograms. Surprisingly, there…
A: Given that You take a random sample of 50 people and record their body weight in kilograms.…
Q: Volcano Eruption Data Approximate Number of Eruptions Since 2200 B.C. (unless otherwise indicated)…
A: The data is mainly classified into 2, primary data and secondary data. Primary data is the data that…
Q: Using the following time series data of U.S. new car sales ($ millions), respond to the following…
A: b. Consider, the regression equation, Excel Procedure: Enter Year and Sales in Excel Go to Data…
Q: Which of the following patterns is not present in a time series? Multiple Choice Trend Cyclical…
A: The objective is to find the given patterns is not present in a time series.
Q: For a certain company, the monthly percentages of all shipments received on time over the past 12…
A: b) Three month moving average:
Q: Using the following time series data of U.S. new car sales ($ millions), respond to the following…
A: Given information: Year sales Predicted Residuals Lagged Residuals Squared difference squared…
Q: State the Five Number Summary for the following dataset. 0.03 0.04 0.05 0.07 0.08 0.09…
A: given data in ascending order; number of…
Q: Listed below are the numbers of unprovoked shark attacks worldwide for the last several years. Why…
A:
Q: Consider the following time series data: Week 3 4 5 6 2. 1.
A: (a). Using the naïve method as the forecast for the next week compute mean absolute error MAE: Given…
Q: Calculate the seasonal variation indices by the method of link relatives for the following figures :…
A:
Q: year Fraquency Percent 1911-1920 Birth 1. 1921-1930 1931-1940 1941-1950 1951-1960 |1961- 1970…
A: Frequency Distribution: In Statistical theory, a frequency distribution is a tabular, listed or…
Q: a) The cumulative frequency table below shows the marks eamed by 1400 students in Mathematies and…
A: Solution Given that The Median is the mid point of the value. The median is the second quartile. The…
Q: Given below are the numbers of indoor movie theaters, listed in order by row for each year. Use the…
A:
Q: The elevation of a lake surface (feet above sea level) varies according to the annual flow of a…
A: Given: Time Period Elevation 1 4817 2 4819 3 4824 4 4822 5 4826 6 4831 7 4836 8…
Q: a) The cumulative frequency table below shows the marks earned by 1400 students in Mathematics and…
A: Since you have asked multiple question, we will solve the first question for you. If you want any…
Q: The number of tourists who visit a coastal town is shown in the graph below. Number of tourists 16…
A: The given time series data for the visited number of tourists is:
Q: • ? = 1000 FTES • median = 1,014 FTES • ? = 474 FTES • first quartile = 528.5 FTES • third quartile…
A: Here given third quartile = 1447.5 FTES Third quartile represent 75Th percentile of data so 75 % of…
Q: This graph is an example for a. time-series data Ob. panel-data c. experimental data d.…
A: Times series data is a data that collected at different point in different time. The cross-sectional…
Q: Use the cumulative frequency table on the left(top) to fill in the table on the right.(bottom)…
A: Formula for relative frequency is given by: Relative frequency = (Frequency/ Total frequency)
Q: From the data given below, find the second five years moving average. Year Sales 2012 20 2013 25…
A: The following is the data provided: Period Data 2012 20 2013 25 2014 30 2015 35 2016 40…
Q: Consider the following time series data. Week 1 2 3 4 5 6
A: Note: Hi there! Thank you for posting the question. As you have posted multiple questions, as per…
Q: Calculate the 3 yearly and 5 yearly moving averages for the following time series :
A: here use 3 yearly and 5 yearly moving average formula for 3 year moving average Ft = At-3 +At-2…
Q: 43.30 53.02 63.52 45.93 48.26 50.51 49.57 43.93 46.77 59.12 54.49 47.38 40.78 45.05 50.37 54.91…
A: The given data is , Year annual rainfall ( inches ) 1 43.3 2 53.02 3 63.52 4 45.93 5…
Q: In the theory of time series, earthquakes can be considered as a. Seasonal Variation b. Cyclical…
A: There are four components of time series a. Seasonal Variation b. Cyclical Variation c. Irregular…
Step by step
Solved in 2 steps with 1 images