Given the bivariate data: 1 5. y (a) Draw a scatter diagram for the data. 40 Graph Layers After you add an object to the graph you can use Graph Layers to view and edit its properties. Fill -10 110 No Solution O Help WebAssign. Graphing Tool (b) Find n, Ex, Ey, Ex2, (Ex)2, and Exy. = 5 Σχ 17 %3D Ey Ex2 = 20 75 %3D (Ex)2 = 110 Exy = 46 (c) Find a, the slope of the least-squares line, and b, the y-intercept of the least-squares line. (Round your answers to two decimal places.) a = 8.35 b = -1.28
Given the bivariate data: 1 5. y (a) Draw a scatter diagram for the data. 40 Graph Layers After you add an object to the graph you can use Graph Layers to view and edit its properties. Fill -10 110 No Solution O Help WebAssign. Graphing Tool (b) Find n, Ex, Ey, Ex2, (Ex)2, and Exy. = 5 Σχ 17 %3D Ey Ex2 = 20 75 %3D (Ex)2 = 110 Exy = 46 (c) Find a, the slope of the least-squares line, and b, the y-intercept of the least-squares line. (Round your answers to two decimal places.) a = 8.35 b = -1.28

MATLAB: An Introduction with Applications
6th Edition
ISBN:9781119256830
Author:Amos Gilat
Publisher:Amos Gilat
Chapter1: Starting With Matlab
Section: Chapter Questions
Problem 1P

Related questions
Question
100%
Given the bivariate data:
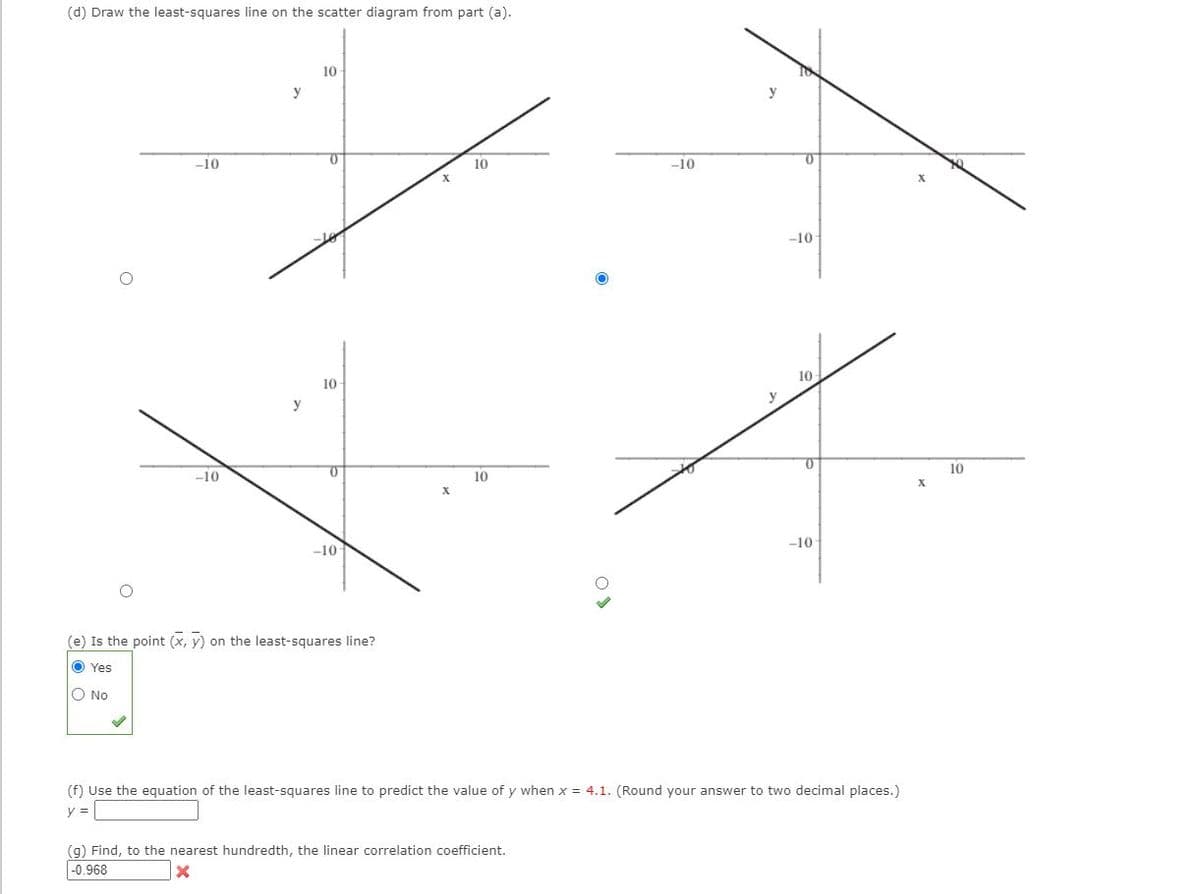
Transcribed Image Text:(d) Draw the least-squares line on the scatter diagram from part (a).
10
y
-10
10
-10
-10
10
10
y
y
10
-10
10
х
-10
-10
(e) Is the point (x, y) on the least-squares line?
O Yes
O No
(f) Use the equation of the least-squares line to predict the value of y when x = 4.1. (Round your answer to two decimal places.)
y =
(g) Find, to the nearest hundredth, the linear correlation coefficient.
|-0.968
Transcribed Image Text:Given the bivariate data:
3
5
6
y
6 5
2
(a) Draw a scatter diagram for the data.
Graph Layers
10
After you add an object to the graph you
can use Graph Layers to view and edit its
properties.
Fill
-10 3 -7
10
No
Solution
-3
O Help
WebAssign. Graphing Tool
(b) Find n, Σx , Σy , Σχ?, (Σx), and Σxy.
= 5
Σχ
17
Ey
= 20
Ix2
= 75
(Ex)2
= 110
Exy
= 46
(c) Find a, the slope of the least-squares line, and b, the y-intercept of the least-squares line. (Round your answers to two decimal places.)
a = 8.35
b = |-1.28
Expert Solution
This question has been solved!
Explore an expertly crafted, step-by-step solution for a thorough understanding of key concepts.

Step by step
Solved in 4 steps with 10 images

Recommended textbooks for you
MATLAB: An Introduction with Applications
Statistics
ISBN:
9781119256830
Author:
Amos Gilat
Publisher:
John Wiley & Sons Inc

Probability and Statistics for Engineering and th…
Statistics
ISBN:
9781305251809
Author:
Jay L. Devore
Publisher:
Cengage Learning

Statistics for The Behavioral Sciences (MindTap C…
Statistics
ISBN:
9781305504912
Author:
Frederick J Gravetter, Larry B. Wallnau
Publisher:
Cengage Learning
MATLAB: An Introduction with Applications
Statistics
ISBN:
9781119256830
Author:
Amos Gilat
Publisher:
John Wiley & Sons Inc
Probability and Statistics for Engineering and th…
Statistics
ISBN:
9781305251809
Author:
Jay L. Devore
Publisher:
Cengage Learning
Statistics for The Behavioral Sciences (MindTap C…
Statistics
ISBN:
9781305504912
Author:
Frederick J Gravetter, Larry B. Wallnau
Publisher:
Cengage Learning

Elementary Statistics: Picturing the World (7th E…
Statistics
ISBN:
9780134683416
Author:
Ron Larson, Betsy Farber
Publisher:
PEARSON

The Basic Practice of Statistics
Statistics
ISBN:
9781319042578
Author:
David S. Moore, William I. Notz, Michael A. Fligner
Publisher:
W. H. Freeman

Introduction to the Practice of Statistics
Statistics
ISBN:
9781319013387
Author:
David S. Moore, George P. McCabe, Bruce A. Craig
Publisher:
W. H. Freeman