
Linear Algebra: A Modern Introduction
4th Edition
ISBN: 9781285463247
Author: David Poole
Publisher: Cengage Learning
expand_more
expand_more
format_list_bulleted
Related questions
Question
thumb_up100%
No Chatgpt please
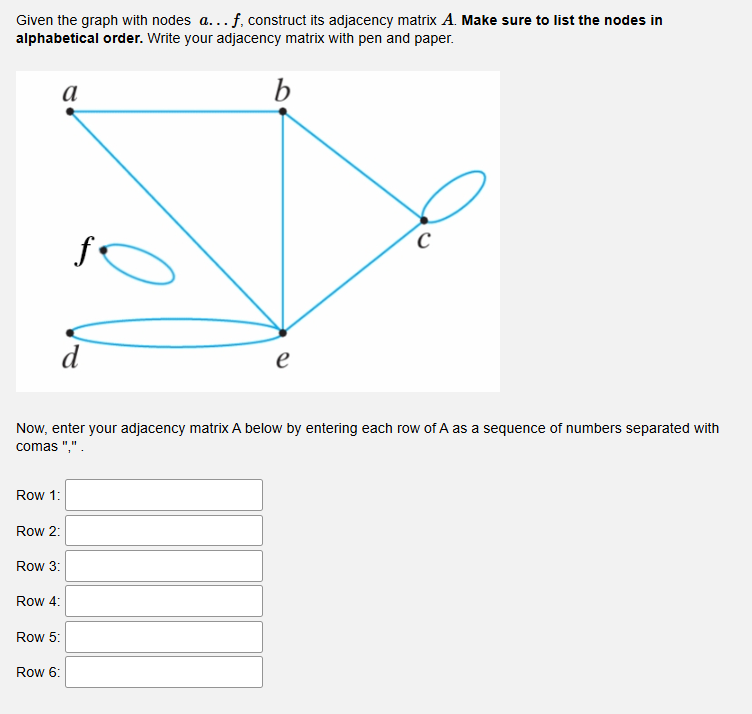

Transcribed Image Text:Given the graph with nodes a... f, construct its adjacency matrix A. Make sure to list the nodes in
alphabetical order. Write your adjacency matrix with pen and paper.
a
b
f
C
d
e
Now, enter your adjacency matrix A below by entering each row of A as a sequence of numbers separated with
comas ","
Row 1:
Row 2:
Row 3:
Row 4:
Row 5:
Row 6:

Expert Solution
This question has been solved!
Explore an expertly crafted, step-by-step solution for a thorough understanding of key concepts.

Step by stepSolved in 2 steps with 1 images

Knowledge Booster

Similar questions
- A researcher randomly selected 158 personal vehicles and noted the type of vehicle and its color. The two-way table displays the data. A 5-column table with 4 rows. Column 1 has entries sedan, S U V, convertible, total. Column 2 is labeled Red with entries 14, 9, 20, 43. Column 3 is labeled Blue/Green with entries 31, 19, 6, 56. Column 4 is labeled Black/Gray with entries 22, 34, 3, 59. Column 5 is labeled Total with entries 67, 62, 29, 158. The columns are titled Vehicle color and the rows are titled vehicle type. Suppose a vehicle is randomly selected. Let event C = convertible and R = red. What is the value of P(R|C)? StartFraction 29 Over 158 EndFraction StartFraction 43 Over 158 EndFraction StartFraction 20 Over 43 EndFraction StartFraction 20 Over 29 EndFractionarrow_forwardFind the adjacency matrixarrow_forwardThe whole data set will be in the two picturesarrow_forward
- O b aarrow_forwardPlot the following points on the scatter diagram:{(0,2),(1,1),(2,4),(3,3),(4,4),(5,7),(6,3),(7,5),(8,10),(9,7),(10,7)}. Plot the points carefully and use the "Remove Last Point" button to replot a point if you make an error. What is the approximate correlation coefficient (r) for your scatter diagram? Between .50 and .69Between .70 and .89Between .90 and 1arrow_forwardFind matrix X: 3. 6 5 4 -2 *X= 18 49 -20 6arrow_forward
- This network represents the distribution of dried fruit used to make cake from 2 wholesalers to 3 bakeries. Nodes A and B are the wholesalers and nodes X, Y and Z are 3 bakeries. The decimal number on each arc shows the proportion of fruit sent from each wholesaler to each bakery ie. 25% of the fruit from wholesaler A is sent to Bakery Z. Write down the matrix which represents this network and then use this matrix to determine the amount of dried fruit received by bakeries X, Y and Z if 450 kg of dried fruit is distributed from wholesaler A and 750 kg is distributed from wholesaler B.arrow_forwardA researcher collected data on how much extra sleep subjects got after being placed into one of two groups. Each group received a different set of mediation exercises. The dataset they collected is called df and the first 6 rows are shown here: Which lines of code are required to make the plot above? Click all that apply. a. geom_boxplot(alpha = .3) b. geom_jitter(width=.1, size = 2, color = "navy") c. geom_boxplot(fill = "dodgerblue", alpha = .3) d. geom_jitter(color = "navy") e. ggplot(sleep, aes(x = group, y = extra)) f. theme_classic()arrow_forwardConstruct two histograms showing the distribution of prices for homes without central air and the prices for homes with central air.First, create the two columns of data. On the Data worksheet, copy the Price column to columns P and Q. In cell P1, type Price without central air. In cell Q1, type Price with central air. Then select the first row, go to the Home tab of the Ribbon, and select Sort&Filter in the Editing group. Select Filter in the drop-down menu. In cell E1, open the drop-down menu and select to show only value 0. Delete all of the filtered values in column Q. Then in cell E1 in the drop-down menu, select to show only value 1. Delete all of the filtered values in column P. Go back to cell E1 and select to show all values.Construct the histogram using Data Analysis for the Price without central air column using the Binsize column K (starting on cell K1). Choose cell R1 on the Data worksheet as the output range. Be sure to check the ‘Labels’ and ‘Chart Output’ boxes in…arrow_forward
- The entirety of the data set will be in the two picturesarrow_forwardCan you show that Q is an intensity matrix?arrow_forwardThe table shows the distribution of scores on score freq Quiz for Sections 01-08.a) Find the median quiz scoreb) Find the mean quiz score. Find the modec) Write the table in matrix for and hence find transpose of matrix.arrow_forward
arrow_back_ios
SEE MORE QUESTIONS
arrow_forward_ios
Recommended textbooks for you
- Linear Algebra: A Modern IntroductionAlgebraISBN:9781285463247Author:David PoolePublisher:Cengage Learning
 Algebra & Trigonometry with Analytic GeometryAlgebraISBN:9781133382119Author:SwokowskiPublisher:Cengage
 Elementary Linear Algebra (MindTap Course List)AlgebraISBN:9781305658004Author:Ron LarsonPublisher:Cengage Learning
Linear Algebra: A Modern Introduction
Algebra
ISBN:9781285463247
Author:David Poole
Publisher:Cengage Learning
Algebra & Trigonometry with Analytic Geometry
Algebra
ISBN:9781133382119
Author:Swokowski
Publisher:Cengage
Elementary Linear Algebra (MindTap Course List)
Algebra
ISBN:9781305658004
Author:Ron Larson
Publisher:Cengage Learning