Given the stem-and-leaf diagram. Answer the following questions: • The total frequency Observations of the stem that has largest frequency 1 32 |1 32|56789 33|114 33|56666688 34 |0111223 17 24 34 |55666667777779 35 |001112344 35|56789 36|234 36|6888 37|13 37|689 (14) 26 17 12 9 5 3
Given the stem-and-leaf diagram. Answer the following questions: • The total frequency Observations of the stem that has largest frequency 1 32 |1 32|56789 33|114 33|56666688 34 |0111223 17 24 34 |55666667777779 35 |001112344 35|56789 36|234 36|6888 37|13 37|689 (14) 26 17 12 9 5 3

Holt Mcdougal Larson Pre-algebra: Student Edition 2012
1st Edition
ISBN:9780547587776
Author:HOLT MCDOUGAL
Publisher:HOLT MCDOUGAL
Chapter11: Data Analysis And Probability
Section11.5: Interpreting Data
Problem 1C

Related questions
Question
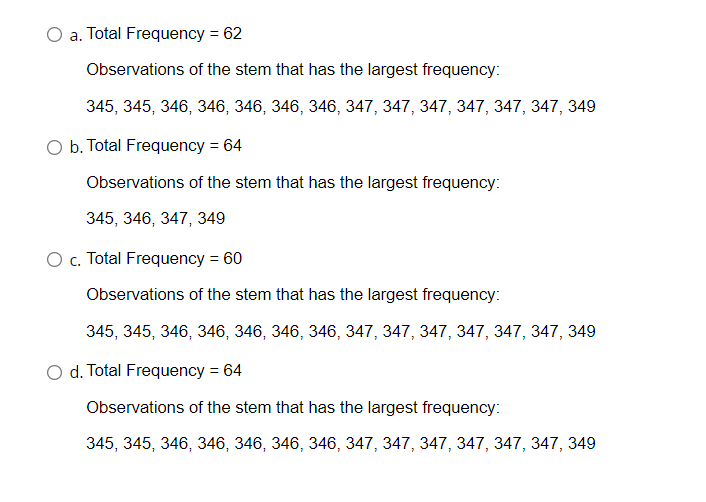
Transcribed Image Text:a. Total Frequency = 62
Observations of the stem that has the largest frequency:
345, 345, 346, 346, 346, 346, 346, 347, 347, 347, 347, 347, 347, 349
O b. Total Frequency = 64
Observations of the stem that has the largest frequency:
345, 346, 347, 349
O c. Total Frequency = 60
Observations of the stem that has the largest frequency:
345, 345, 346, 346, 346, 346, 346, 347, 347, 347, 347, 347, 347, 349
O d. Total Frequency = 64
Observations of the stem that has the largest frequency:
345, 345, 346, 346, 346, 346, 346, 347, 347, 347, 347, 347, 347, 349
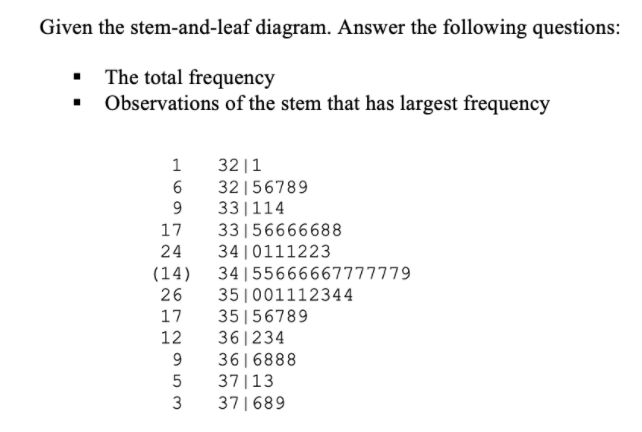
Transcribed Image Text:Given the stem-and-leaf diagram. Answer the following questions:
The total frequency
Observations of the stem that has largest frequency
32|1
32|56789
33|114
33|56666688
1
6
9.
17
24
34 |0111223
34 |55666667777779
35 |001112344
35 |56789
36|234
36|6888
37|13
371689
(14)
26
17
12
5
3
Expert Solution
This question has been solved!
Explore an expertly crafted, step-by-step solution for a thorough understanding of key concepts.

Step by step
Solved in 2 steps with 1 images

Recommended textbooks for you
Holt Mcdougal Larson Pre-algebra: Student Edition…
Algebra
ISBN:
9780547587776
Author:
HOLT MCDOUGAL
Publisher:
HOLT MCDOUGAL
Holt Mcdougal Larson Pre-algebra: Student Edition…
Algebra
ISBN:
9780547587776
Author:
HOLT MCDOUGAL
Publisher:
HOLT MCDOUGAL