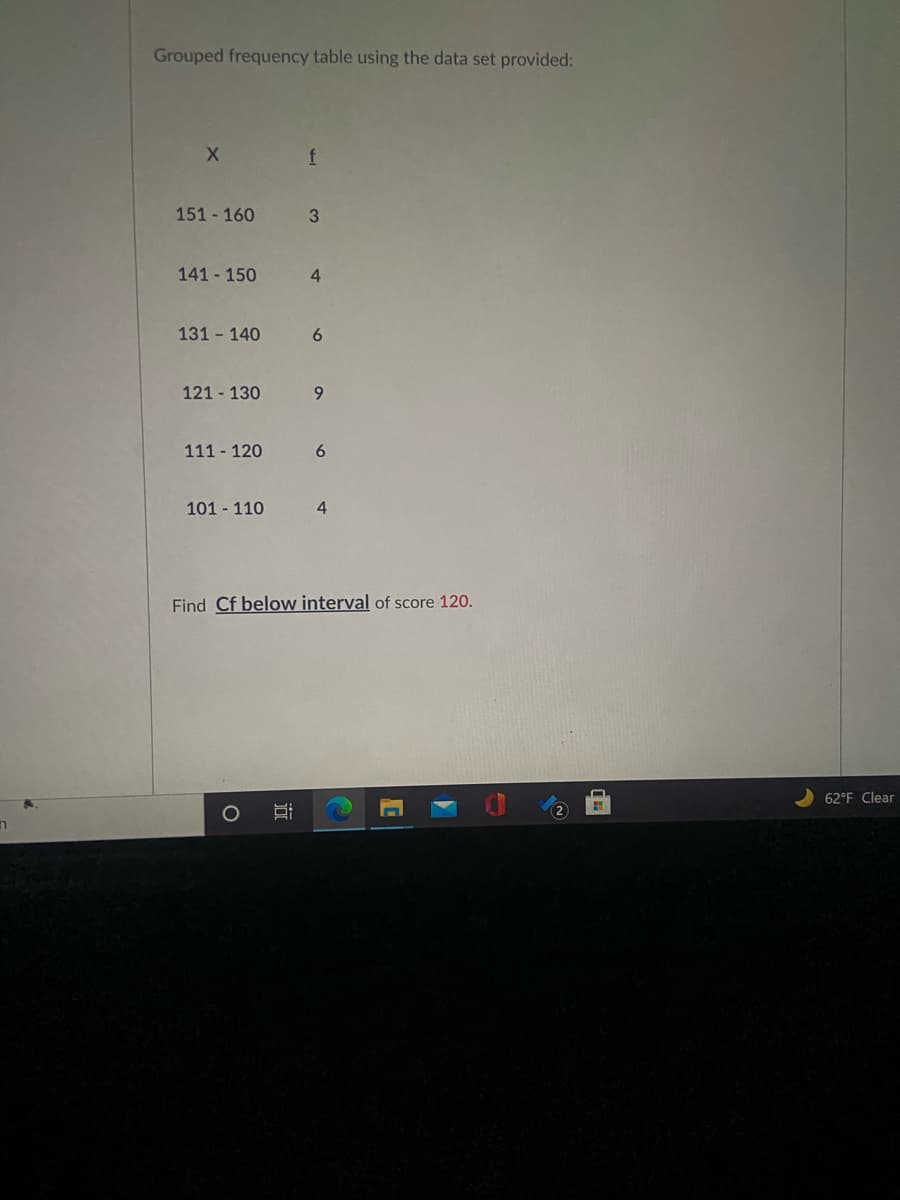
Grouped frequency table using the data set provided: f 151 - 160 141 150 4. 131 140 6. 121 - 130 111 120 101 110 4 Find Cf below interval of score 120.


Q: Use the frequency distribution shown below to construct an expanded frequency distributie High…
A: Given Data, Class Frequency 18-28 18 29-39 45 40-50 68 51-61 69 62-72 75 73-83 68…
Q: The data below show the finishing times (in minutes) for people in a running group who participated…
A: Given information: 201, 214, 218, 220, 222, 230, 236, 239, 242, 247, 249, 254, 293, 318
Q: Find the mean of the data summarized in the given frequency distribution. Compare the computed mean…
A: From the provided information, The frequency distribution table is as follow: Low Temperature…
Q: c. Organize the data into a relative frequency table. Use the following intervals: 119.5 - 124.5,…
A: Solution-: We find relative frequency histogram:
Q: Assuming you are working as a data engineer of a car manufacturer, your boss asked you to present…
A: Grouped data:- Frequency distribution table, Relative frequency 4/40= 0.10 5/40= 0.125…
Q: Based on this histogram, draw the ogive (the cumulative frequency polygon) for the Accu-Rating data.…
A: From the histogram the frequency table is, Aggregate tuning hours Frequency 200 - 400 4 400 -…
Q: Find the range for the given data. The amount that Jeremy has saved in each of the last six months…
A: From the given information, the minimum value is 113 and the maximum value is 655.
Q: Construct one table that includes relative frequencies based on the frequency distributions shown…
A:
Q: Find the mean for the data items in the given frequency distribution. Score, x Frequency, f 1 3 4 7…
A: The data is, Score 1 2 3 4 5 6 7 8 Frequency 3 2 4 3 4 5 4 2
Q: Find the mean of the data summarized in the given frequency distribution. Compare the computed mean…
A:
Q: 92 94 86 88 99 06 66 99 84 92 frequency distribution for the data using 6 cla: frequency…
A: The given data is 59, 61, 66, 71, 82, 83, 83, 84, 85, 86, 86, 88, 88, 88, 88, 88, 89, 89, 89, 90,…
Q: Use the frequency histogram to complete the following parts. Employee Salaries 300- (a) Determine…
A: Given a frequency histogram showing employee salaries.
Q: Find the range for the given data set. A class of sixth grade students kept accurate records on the…
A: Given data set, Range=?
Q: B/ Classify the following data into a frequency table (take number of classes = 6). Then, sketch the…
A: Introduction : Frequency polygon: For an ungrouped data type the frequency polygon can be…
Q: See attached table of grade point averages. One hundred seniors were chosen at random from a…
A: A Construct the frequency and relative frequency table using a class interval 0.2 starting the lower…
Q: Use the frequency histogram to complete the following parts. (a) Identify the class with the…
A: The histogram shows the female fibula lengths.
Q: * ?Q5. Based on the below table, What is the valu Interval Midpoint Frequency Relative frequency 1-9…
A: From the table, we have (5/Total frequency) = 0.1429 Total frequency= (5/0.1429) =35
Q: The amount (in dollars) of the monthly electric 30 318 bill for 30 households is shown to the right.…
A: Let us arrange the data values in ascending order: 30 38 38 41 41 61 62 72 85…
Q: Find the median for the data items in the given frequency distribution Score, X Frequency, f 6 4 6 2…
A: First, we will find the sum of the given frequency and then will check at which position the score…
Q: Make a frequency distribution for the following data of inches of rainfall in Brooklyn per year,…
A: Since you have posted a question with multiple sub-parts, we will solve first three sub- parts for…
Q: а. Construct an FDT for the data using five class intervals b. What the table tells you, what can…
A:
Q: Grade on Statistics Exam Frequency 6. Below 50 50 – 59 60 – 69 12 70 – 79 10 80 – 89 17 - 90 – 100…
A: Given,
Q: What is the median of the set of data? Complete the table. Class Frequency Lower Boundary Class Mark…
A: Class Frequency (f) Lower boundary (LB) Mid value (x) f⋅x <cf 7-13 8 6.5 10…
Q: classes are repeated When plotting the frequency curve for the following data: The coordinates of…
A: The frequency table with categories and the frequencies are shown below:
Q: Find the median from the grouped frequency distribution table. Class Frequency (f) (X) 0-10 10 11-21…
A:
Q: Develop the frequency table of the data From the frequency table, calculate each of the following…
A: [Disclaimer: Since, you have asked multipart question, we will solve the first three sub part for…
Q: Complete the frequency distribution shown below.
A: The midpoint is obtained below:The formula for midpoint is,Midpoint = Upper bound + Lower bound /…
Q: Data was collected for 300 fish from the North Atlantic. The length of the fish (in mm) is…
A: Introduction: In general frequency distribution is a table or graph that displays the frequency of…
Q: An environmental organization releases an annual beach report card based on water quality. The…
A: The grades for 20 beaches in three counties in a certain state during dry weather are given below. B…
Q: BI Add the midpoint of each class, the relative frequency, percentage frequency, and the cumulative…
A: Let us notation Cf=Cumulative Frequency F=frequency CI=Class interval
Q: The amount of caffeine in a sample of five-ounce servings of brewed coffee is shown in the…
A: The frequency distribution table is given as, f Midpoint x xf 2 70.5 141 13…
Q: Find the mean of the data summarized in the given frequency distribution. Compare the computed mean…
A: # Given: frequency distribution of data for temperature then to find mean of the frequency…
Q: Find the median for the data items in the given frequency distribution 1 2 3 5 6 7 Score, x…
A: Using median online calculator
Q: Identify what is asked. Show your complete solutions and interpret the results on a separate sheet…
A: “Since you have asked multiple questions, we will solve the first question for you. If you want any…
Q: 45. Find the mean of this frequency table. Price, p ($) Frequency, f 730 1 785 3 815 4 846 2 910 957…
A:
Q: The data below show the finishing times (in minutes) for people in a running group who participated…
A: A frequency is the number of times a value of the data occurs A relative frequency is the ratio…
Q: The frequency distribution below summarizes the home sale prices in the city of Summerhill for the…
A: Solution-: We have following table: Class Frequency 80-110.9 2 111-141.9 5 142-172.9 7…
Q: Using the following set of data, complete the frequency table below using 12 intervals then find the…
A: From the provided data we have the frequency table as below: Class Frequency Class mark…
Q: Data was collected for 300 fish from the North Atlantic. The length of the fish (in mm) is…
A: Class Limits: Class limits are the minimum and maximum values of each class interval.The minimum…
Q: Situation For the grouped data tabulated below Frequency Class Interval 118-126 127-135 136-144 9.…
A: To find the mean and median of given data Class Interval Frequency 118-126 3 127-135 5…
Q: Complete the relative frequency distribution below. Relative Cause Frequency Pilot error % Other…
A: Given: Causes Frequency Pilot error 168 Other human error 67 Weather 488 Mechanical…
Q: The following table shows data for the price of gasolince (per gallon) in various gas stations in a…
A: The completed frequency table is as below:
Q: Grade on Statistics Exam Frequency Below 50 7 50 59 7 60 – 69 10 70 - 79 19 80 - 89 20 90 – 100 12…
A:
Q: Find the mode(s) for the data items in the given frequency distribution. Score Frequency f 4 2 4. 10…
A: Look for the largest frequency and the corresponding value is the mode
Q: Complete the table below to answer some of these items. Class Interval (C. I.) | Frequency Class…
A: Since we know that the class boundaries are calculated by subtracting 0.5 from the lower- class…
Q: d) Find an estimate of the median score. e) Find the range of the middle 50% of the observations.…
A: Median is the middle most value i.e. the value that divides a distribution into two equal halves.…
Q: Construct one table that includes relative frequencies based on the frequency distributions shown…
A:
Q: onstruct a categorical frequency distribution for the data. Class Frequency Caramel Hazelnut Mocha…
A: Given: C=caramelH=hazelnutM=mochaP=plainV=vanilla From the given data, count the number of times…
Q: From the data above, construct frequency distribution histogram and frequency distribution Ogive (cf
A: Frequency distribution is the representation of data in tabular format by making the classes. Where,…


Trending now
This is a popular solution!

Step by step
Solved in 2 steps with 2 images

- Find the mean of the data from the frequency table: Value Frequency 0 6 1 0 2 6 3 8 4 9 5 6 Give your answer to two decimal places.The data below are the passing scores on an Algebra exam in one class. For this question, round all answers to the nearest tenth, as needed. 60 68 88 76 60 92 92 92 88 60 68 92 8892 64 60 76 64 92 88 76 60 60 64 60 8876 64 Construct the frequency table by using five classes. Class Limit Frequency Class midpoint Cumulative Frequency Class BoundaryDevelop the frequency table of the data From the frequency table, calculate each of the following a) Average d) Inter quartile range (Q3 – Q1) b) Median e) Standard deviation c) 55th percentile – 3rd decile f) Coefficient of variation
- Use the relative frequency table shown to the right to calculate the number of the 400 measurements falling into each of the measurement classes. Then graph a frequency histogram for these data.Use the data above to construct a grouped frequency table with the following column I)Class intervals II)Class boundaries III)Class marks IV) Frequency C)Draw a frequency polygon for the distributionCreate a frequency give for the frequency distribution using the chart for reference.
- 0 - Which of the following frequency does not give information about the status of a data class in the total data? a) percent frequency B) Tuned frequency C) relative frequency D) proportional frequency TO) cumulative frequencyThe class ranks of a very small high school with 20 students are shown in the table below. a) Since data were collected for variable(s), the correct graph to make is a . b) Complete the frequency/relative frequency table. c) Which of the following is the correct bar chart for the given data?See attached table of grade point averages. One hundred seniors were chosen at random from a graduating class at a university and their grade-point averages recorded. A) Construct a frequency and relative frequency table using a class interval of 0.2 starting at 1.95 B) Construct a histogram C) construct a frequency polygon
- Exam scores for 30 students:21 51 64 68 70 74 77 78 81 83 83 85 87 87 87 91 92 92 92 92 93 93 94 94 94 94 95 97 98 99a) In the space below, create a grouped frequency distribution table, using 20-29 asthe first class. b) Determine the five-number summary. _________________________________ c) In space below, draw a histogram. d) In space below, draw the boxplot. e) Identify the shape. ___________________________f) Find the interquartile range. _________________ g) Circle the correct choice: the mean is (greater; less) than the median. h) Circle the correct choice: the (mean; median) gives the more accurate descriptionof overall scores.1. Create the frequency table of the data.Find the mean of the data summarized in the given frequency distribution. Compare the computed mean to the actual mean of 57.4 degrees. The mean of the frequency distribution is (Round to the nearest tenth as needed.)
