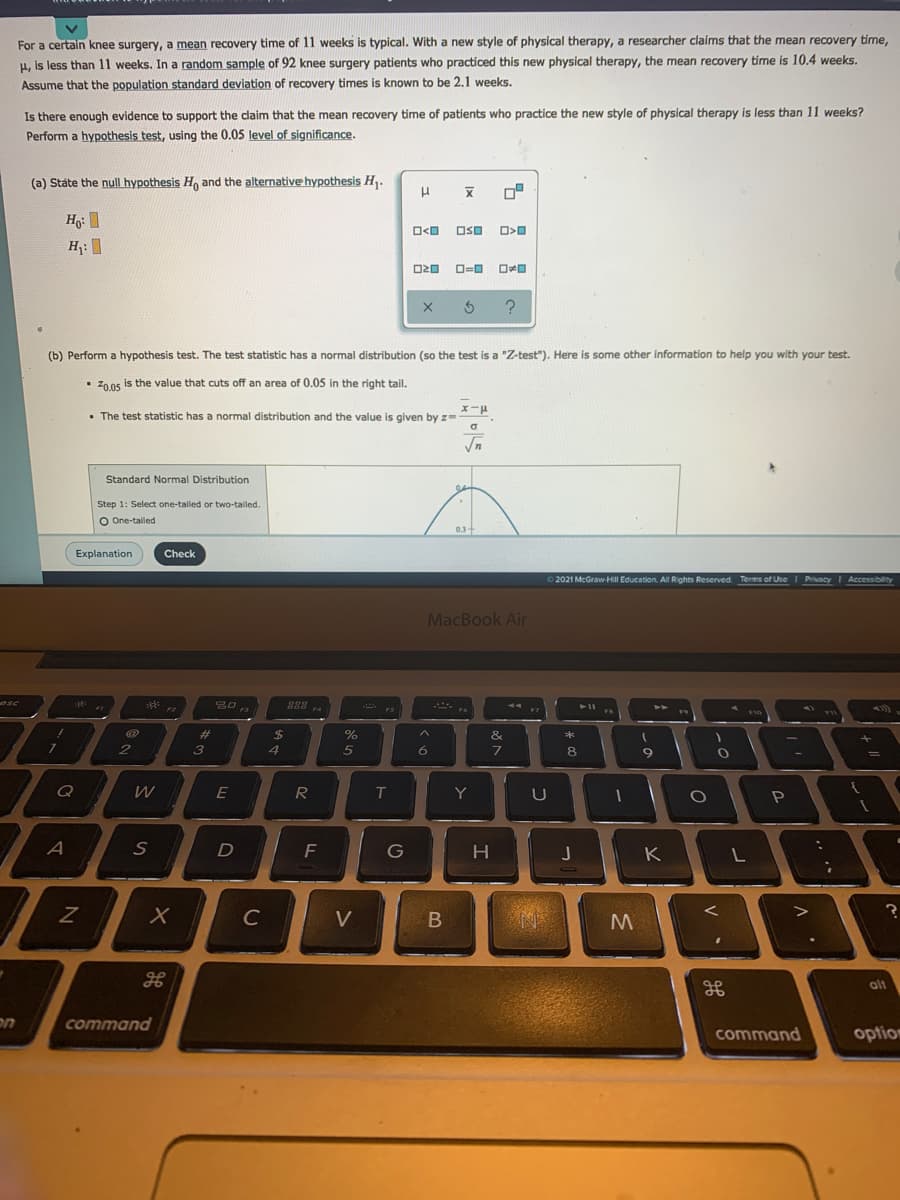
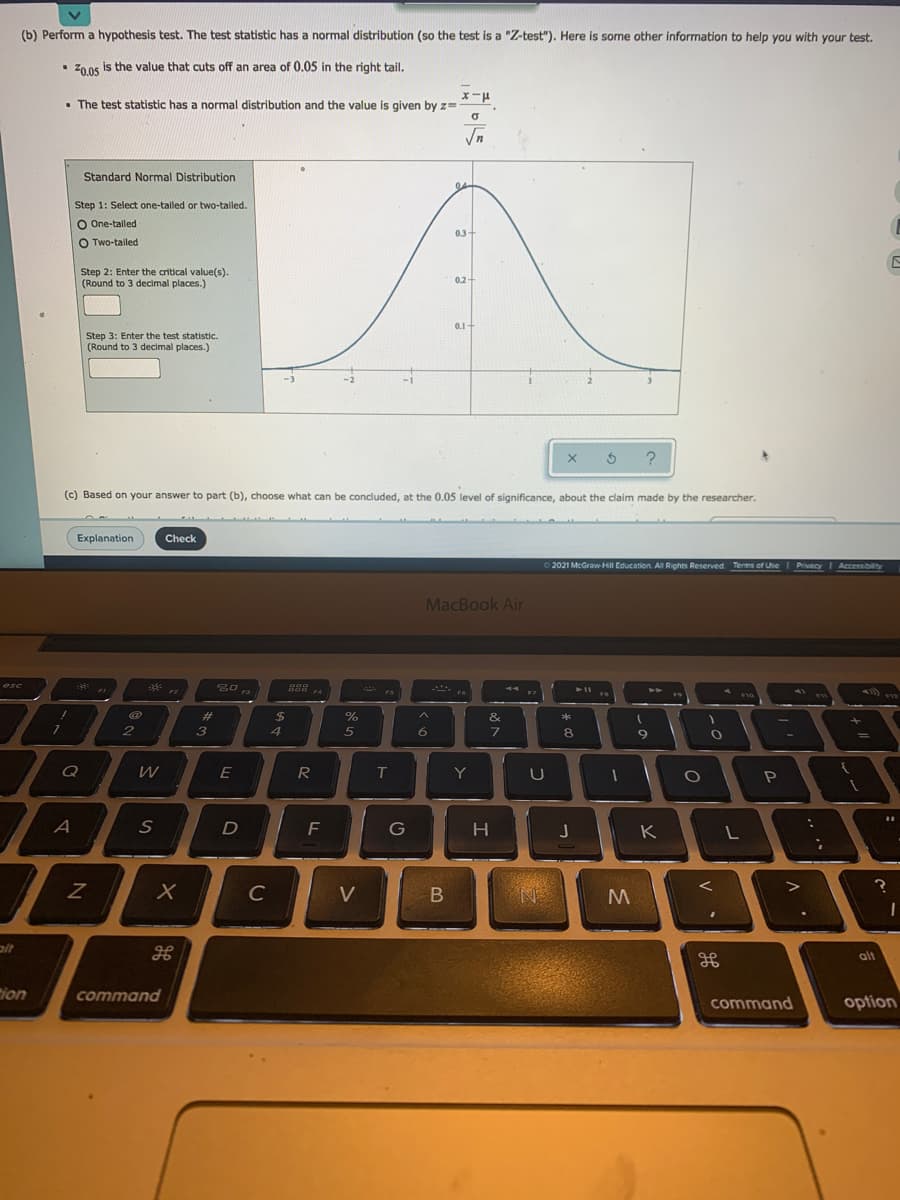
H, is less than 11 weeks. In a random sample of 92 knee surgery patients who practiced this new physical therapy, the mean recovery time is 10.4 weeks. Assume that the population standard deviation of recovery times is known to be 2.1 weeks. Is there enough evidence to support the daim that the mean recovery time of patients who practice the new style of physical therapy is less than 11 weeks? Perform a hypothesis test, using the 0.05 level of significance. (a) State the null hypothesis Ho and the alternative hypothesis Hy. Ho: H: | OSO (b) Perform a hypothesis test. The test statistic has a normal distribution (so the test is a "Z-test"). Here is some other information to help you with your test. • 70.0s is the value that cuts off an area of 0.05 in the right tail. • The test statistic has a normal distribution and the value is given by z-. Standard Normal Distribution Step 1: Select one-tailed or two-talled. Oee-tailed


Unitary Method
The word “unitary” comes from the word “unit”, which means a single and complete entity. In this method, we find the value of a unit product from the given number of products, and then we solve for the other number of products.
Speed, Time, and Distance
Imagine you and 3 of your friends are planning to go to the playground at 6 in the evening. Your house is one mile away from the playground and one of your friends named Jim must start at 5 pm to reach the playground by walk. The other two friends are 3 miles away.
Profit and Loss
The amount earned or lost on the sale of one or more items is referred to as the profit or loss on that item.
Units and Measurements
Measurements and comparisons are the foundation of science and engineering. We, therefore, need rules that tell us how things are measured and compared. For these measurements and comparisons, we perform certain experiments, and we will need the experiments to set up the devices.


Trending now
This is a popular solution!

Step by step
Solved in 2 steps


