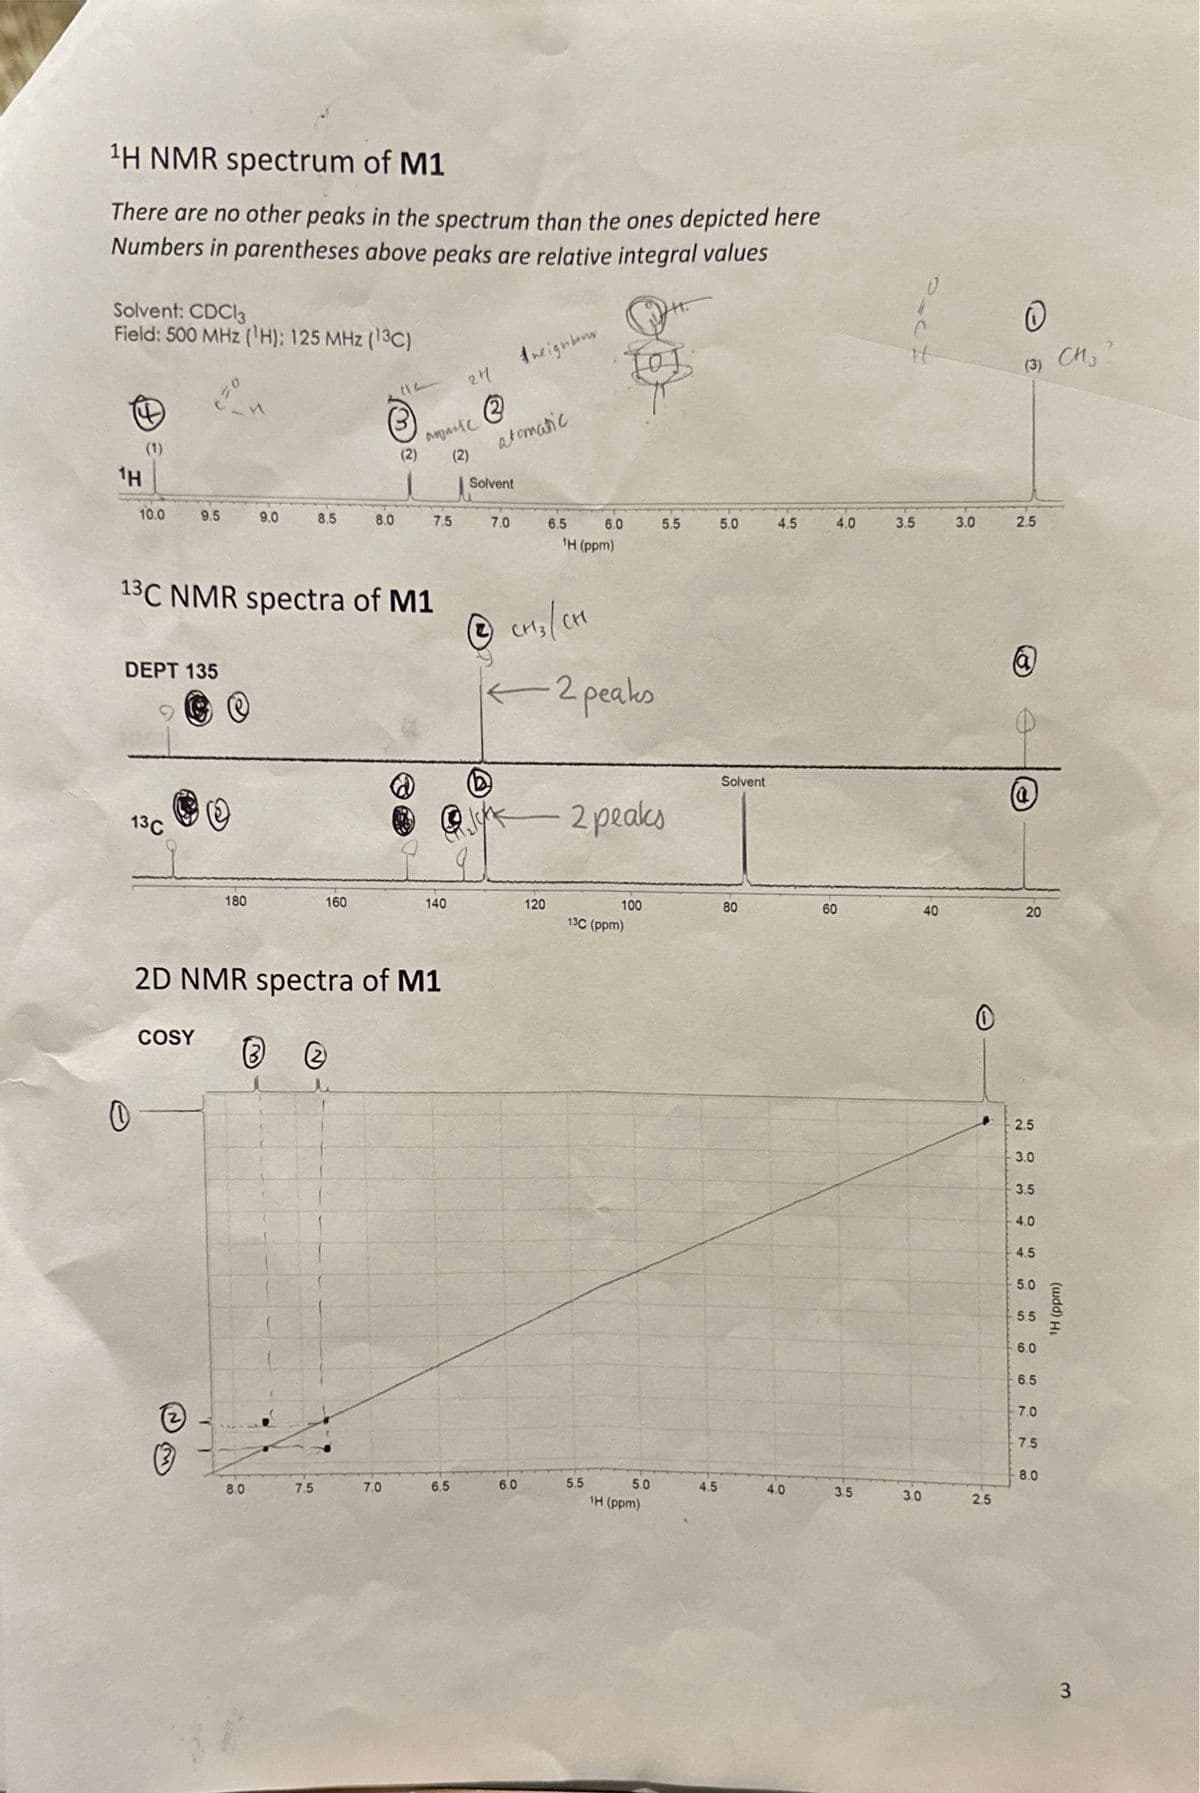
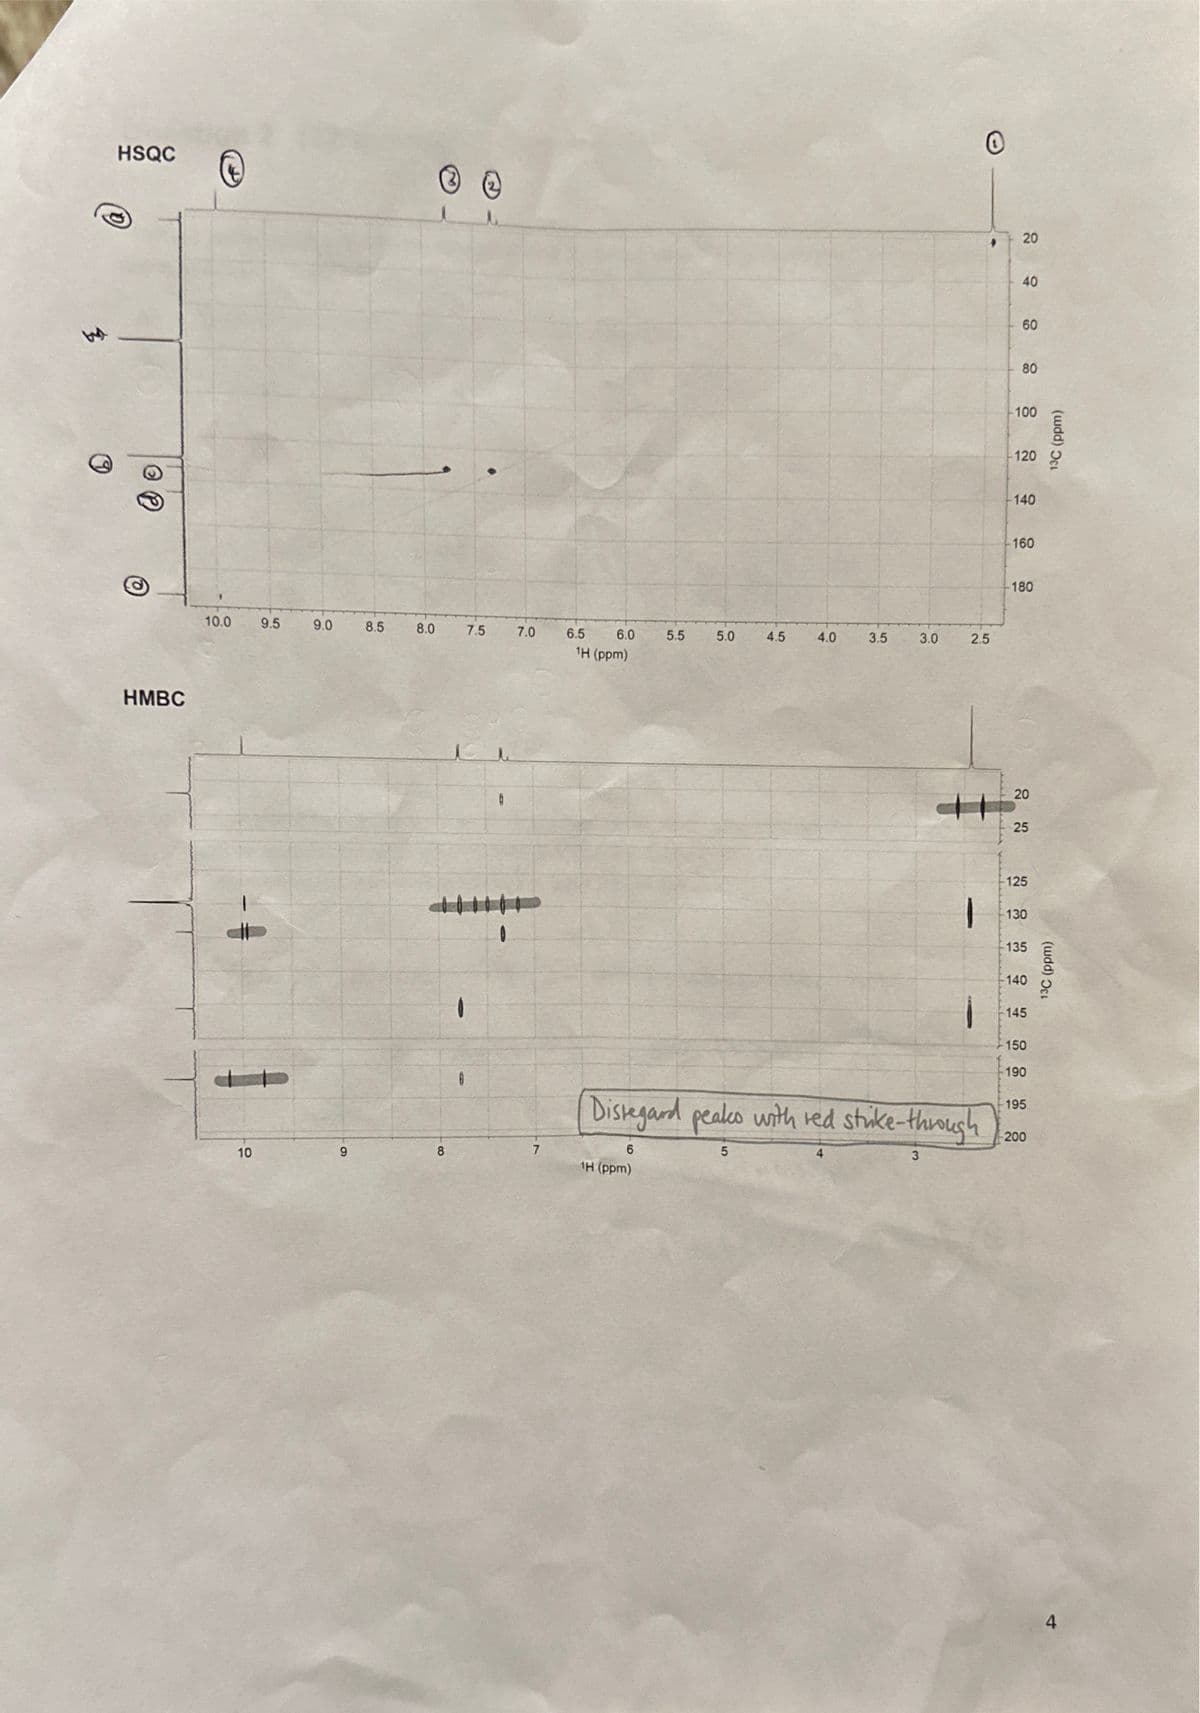
¹H NMR spectrum of M1 There are no other peaks in the spectrum than the ones depicted here Numbers in parentheses above peaks are relative integral values Solvent: CDC13 Field: 500 MHz (¹H): 125 MHz (13C) 1H (1) 10.0 0 9.5 DEPT 135 13C 180 9.0 8.0 8.5 13C NMR spectra of M1 7.5 8.0 160 112 (2) 7.0 aparic (2) 7.5 2D NMR spectra of M1 COSY Ⓡ (2 u 140 241 6.5 Aneighbour atomatic Solvent 7.0 6.0 6.5 120 CH3 / CH ←2 peaks 6.0 ¹H (ppm) 2 peaks 5.5 100 13C (ppm) 5.0 5.5 1H (ppm) 4.5 5.0 Solvent 80 4.5 4.0 4.0 60 3.5 #t 3.5 V 3.0 40 3.0 0 2.5 O (3) CH 2.5 (8) 20 2.5 3.0 3.5 -4.0 -4.5 -5.0 5.5 6.0 6.5 7.0 7.5 8.0 ¹H (ppm)


Analyzing Infrared Spectra
The electromagnetic radiation or frequency is classified into radio-waves, micro-waves, infrared, visible, ultraviolet, X-rays and gamma rays. The infrared spectra emission refers to the portion between the visible and the microwave areas of electromagnetic spectrum. This spectral area is usually divided into three parts, near infrared (14,290 – 4000 cm-1), mid infrared (4000 – 400 cm-1), and far infrared (700 – 200 cm-1), respectively. The number set is the number of the wave (cm-1).
IR Spectrum Of Cyclohexanone
It is the analysis of the structure of cyclohexaone using IR data interpretation.
IR Spectrum Of Anisole
Interpretation of anisole using IR spectrum obtained from IR analysis.
IR Spectroscopy
Infrared (IR) or vibrational spectroscopy is a method used for analyzing the particle's vibratory transformations. This is one of the very popular spectroscopic approaches employed by inorganic as well as organic laboratories because it is helpful in evaluating and distinguishing the frameworks of the molecules. The infra-red spectroscopy process or procedure is carried out using a tool called an infrared spectrometer to obtain an infrared spectral (or spectrophotometer).
The HNMR , CNMR , 2D NMR SPECTRA OF COMPOUND M1 ARE ATTACHED. WHAT IS STRUCTURE OF IT ? IS IT SYMMETRICAL REGARDS TO ITS CNMR SPECTRUM ?
WHAT IS THE STRUCTURE SUGGESTION AND WHY ?


Trending now
This is a popular solution!

Step by step
Solved in 2 steps with 1 images


