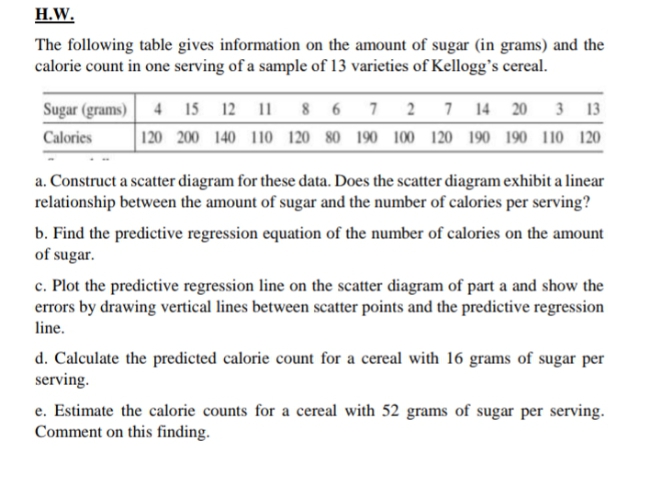
H.W. The following table gives information on the amount of sugar (in grams) and the calorie count in one serving of a sample of 13 varieties of Kellogg's cereal. Sugar (grams) 4 15 12 11 8 6 7 2 7 14 20 3 13 Calories 120 200 140 110 120 80 190 100 120 190 190 110 120 a. Construct a scatter diagram for these data. Does the scatter diagram exhibit a linear relationship between the amount of sugar and the number of calories per serving? b. Find the predictive regression equation of the number of calories on the amount of sugar. c. Plot the predictive regression line on the scatter diagram of part a and show the errors by drawing vertical lines between scatter points and the predictive regression line. d. Calculate the predicted calorie count for a cereal with 16 grams of sugar per serving. e. Estimate the calorie counts for a cereal with 52 grams of sugar per serving. Comment on this finding.


Correlation
Correlation defines a relationship between two independent variables. It tells the degree to which variables move in relation to each other. When two sets of data are related to each other, there is a correlation between them.
Linear Correlation
A correlation is used to determine the relationships between numerical and categorical variables. In other words, it is an indicator of how things are connected to one another. The correlation analysis is the study of how variables are related.
Regression Analysis
Regression analysis is a statistical method in which it estimates the relationship between a dependent variable and one or more independent variable. In simple terms dependent variable is called as outcome variable and independent variable is called as predictors. Regression analysis is one of the methods to find the trends in data. The independent variable used in Regression analysis is named Predictor variable. It offers data of an associated dependent variable regarding a particular outcome.


Trending now
This is a popular solution!

Step by step
Solved in 4 steps with 2 images


